Power BI Report Server Monitoring
Let’s say you’ve recently deployed the Power BI Report Server and you want to get started with some monitoring to answer common questions such as:
- Who is viewing reports?
- Which reports are the most popular?
- When are reports being executed?
- What is performance like (any slow reports?)?
- What % of the workload is Power BI reports versus other report types?
Report Server Monitoring Requirements
In addition to the common questions mentioned, you also want to be able to easily filter on any report failures as well as the scheduled refresh process for any Power BI Desktop files with imported data. As a monitoring solution, you should be able to see what’s happening on your report server in near real-time.
Furthermore, for now at least, you want to limit or avoid any custom M queries or DAX measures unless they’re absolutely essential. A more robust solution such as integrating Active Directory data and/or authoring time intelligence DAX measures could be appropriate in the future when your workload increases.
Solution: Power BI Report (in DirectQuery)
In this scenario, you could use Power BI Desktop (the version optimized for Power BI Report Server), and create a DirectQuery connection to the execution log data stored in your report server database. You could then deploy this report to your report server and store it within a hidden and secured monitoring folder. As a DirectQuery report, you wouldn’t be storing any data or scheduling any data import/refresh jobs – you’d have near real-time visibility to the execution requests of the report server.
Development Process
- Identify the SQL Server and database storing the log data for your Report Server.
- In SQL Server Management Studio (SSMS), connect to the Power BI Report Server instance and open the properties window.
- Via the Logging page, confirm that execution logging is enabled and optionally revise the # of days of log data to store (default is 60).
- Confirm your access to the report server database and determine who will need to access the monitoring report(s).
- Will the user viewing the report need read access to the database or will you configure the report to use a specific set of credentials with access?
- Open the version of Power BI Desktop associated with your version of the Power BI Report Server (e.g. Oct 2017).
- Connect to the Report Server Database (Get Data – SQL Server database ) and choose DirectQuery as the connectivity method.
- Select the ExecutionLog3 view. (dbo.ExecutionLog3). Load.
- Build your monitoring report visuals based on this system view of the log data.
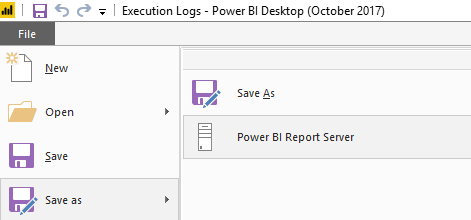
- Save your PBIX file to the Power BI Report Server.
- You’ll probably want this in a monitoring or administration folder.
- Manage the published report with any data source or security properties.
- Test/validate that new log data is flowing into your monitoring report on the report server.
- You’ll probably want to filter out the monitoring report itself from your monitoring report.
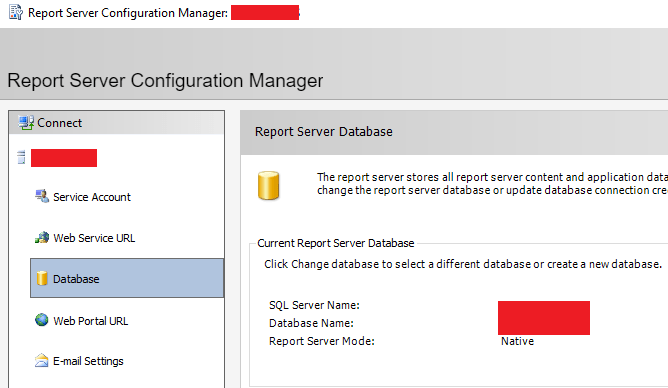
Where is your report server database? If you don’t have this documented you could use the database page of the Report Server Configuration Manager:
In Power BI Desktop for Power BI Report Server, you can get familiar with the ExecutionLog3 data and build some basic report visuals that help answer a few of the common questions.
Save the PBIX to a secured folder on the Power BI Report Server:
Access the report on the Power BI Report Server’s web portal:

To test out your DirectQuery monitoring report, you could open two separate browser windows and run reports in one window while refreshing and/or filtering the Execution Logs report in the other. You should see the activity generated flow through to your report.
This blog post is NOT about data visualization best practices (clearly) or functionality in Power BI Desktop but the following ‘getting started’ report page could be useful:

Notice that the log data view contains fields for filtering on report types (ie PBIX files) and request types such as interactive versus scheduled data refresh. Certainly the log3 data could be enhanced or prepped but for internal monitoring purposes it’s in pretty good shape.
Not a single DAX measure was written and there were no custom M queries/transforms or calculated columns either. You simply use DirectQuery on top of the ExecutionLog3 view and apply some very basic report design elements (slicers, Top X filter). Therefore, you could get started quickly with minimal experience.
To support the long term monitoring needs for a large-scale deployment of Power BI Report Server, you might consider an ETL job for the Log3 data, an archiving table, an import mode dataset, the integration of Performance Counter data, Active Directory, and more.
Note: There were many examples (recipes) somewhat like this blog post in the Power BI Cookbook. Additionally, a full chapter (35 pages) of Mastering Power BI is dedicated to the Power BI Report Server.
It wouldn’t surprise me if a standard Power BI Report Server monitoring template was made available that you could just point to your report server database.
Wrapping Up
Next week’s blog post will likely look at leveraging the Details Rows feature of SSAS 2017 via paginated reports (RDL) in the Power BI Report Server. You might consider subscribing (click Follow) if you like this blog.

How did you get execution count? When I click and open one report, I see about 10-14 records in ExecutionLog3.
LikeLike
I used the ExecutionId field and applied the Count summarization to this field. In almost all cases I’d recommend creating DAX measures in the dataset and using these for report visuals but for this blog example I wanted something that didn’t require any DAX. If you drag the ExecutionId field into the Value field well and click the dropdown next to the field name you should be able to select Count (as opposed to Count (Distinct)). You could also create a DAX measure for the row count of the log file such as Count of Executions = COUNTROWS(‘ExecutionLog3’).
LikeLike