Drillthrough to Detail Rows
Detail rows is one of the top features of Analysis Services 2017 (1400CL) as it allows the model author to define the supporting context accessible to users from aggregated values in reports. Custom detail row expressions (in DAX) can be defined per measure and a default detail row expression can be defined at the table level.
The most common use case for detail rows is Excel (MDX client). Currently, Power BI (DAX client), cannot take advantage of these expressions via standard live connection. However, you can pass a parameterized DAX query from Power BI to Analysis Services which uses the detail rows expression as explained in this blog post.
So that’s Excel and Power BI, what about paginated reports (.rdl) in SQL Server Reporting Services (SSRS) and the Power BI Report Server? Yes, that’s the subject of this blog post.
Paginated Report Drillthrough to Detail
Before walking through the development details, here are the design essentials in terms of the paginated reports (excluding Analysis Services 2017):
- A target report with a dataset based on a DAX query which utilizes the DETAILROWS() function.
- The target report will include a parameter which will serve as the link between the source and target reports.
- A source report that includes an Action which references the target report.
- The Action will be defined to pass the value of the source report column to the parameter of the target report.
If you’re familiar with Actions and linked reports in SSRS this is the same basic pattern. The only difference is we’re using DAX queries. In this example, I’m using the Power BI Report Server but you can also use SSRS as well – you’ll just need an 1400CL Analysis Services model for the Detail Rows expression.
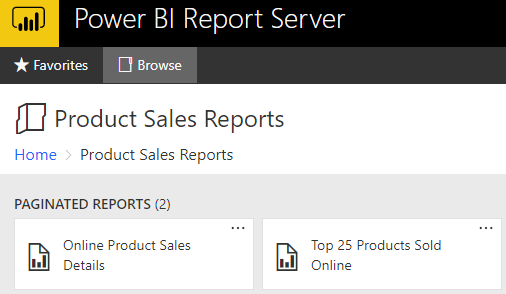
Both paginated (.rdl) reports contain simple tables but the Top 25 report is the source report (aggregated) while the Details report exposes the maximum grain of the internet sales fact table (via the DETAILROWS() function).
In Analysis Services, the default detail rows expression for the Internet Sales table is a SELECTCOLUMNS() query that selects several of the most important attributes from dimensions related to Internet Sales. Part of this expression looks like this:
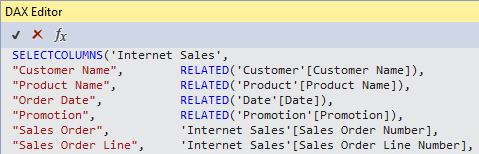
So when we reference DETAILROWS() in our paginated report, we avoid the need to write out a much more lengthy SELECTCOLUMNS() query.
Before you dive into a Report Server Project in SSDT, you’ll need to decide which column to use for the drillthrough and you’ll probably want to test your dataset queries in SSMS or DAX Studio:

In this example, I’m using the product name column and choosing to include this column in the detail report. Technically the drillthrough column only needs to be exposed to the user on the source report – it could serve as just a filter for the target report.
1. Create the Target (Detail) Report
- Add a shared data source reference to the report that uses the Analysis Services Tabular 2017 (1400 CL model) data source.
- Add a dataset (embedded in the report) and select the shared data source.
- Click the Query Designer button at the bottom of the Dataset Properties dialog.
- Click the Design Mode icon (triangle) at the top of the Query Designer window.

- Paste in the DAX query containing the DETAILROWS() function.
- The ability to import a DAX query file would be nice.
- Run your query (exclamation icon) with no parameter:
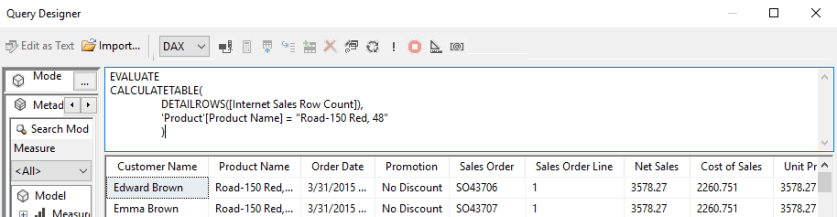
In this example, I want to use the default detail rows expression for the Internet Sales fact table. Therefore, we reference a row count measure that doesn’t have its own detail rows expression and surely won’t in the future. Beyond this, we just need to filter the table by the column that will serve as the drillthrough column.
- Create a hidden report parameter (ProductNameParam) with a default value for the column such as Road-150 Red, 48.
- Open the Parameters page of the Dataset Properties dialog and add a parameter that references your report parameter for the Parameter Value.

- Open Query Designer and replace the hard coded value with a reference to a parameter (@ProductNameParam).
- Click the Query Parameters icon to associate your declared query parameter to the dataset parameter.

At this point, you can close out of the dataset and test that your report parameter value is being passed through. Just tweak the default value and switch from Design to Preview to see the product name change in a table.
2. Create the Source (Summary) Report
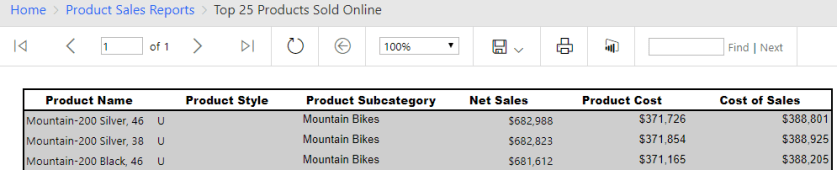
In this example, the source report (summary level) returns the Top 25 products sold online either this year or the prior year grouped by three product columns and displayed in descending order:
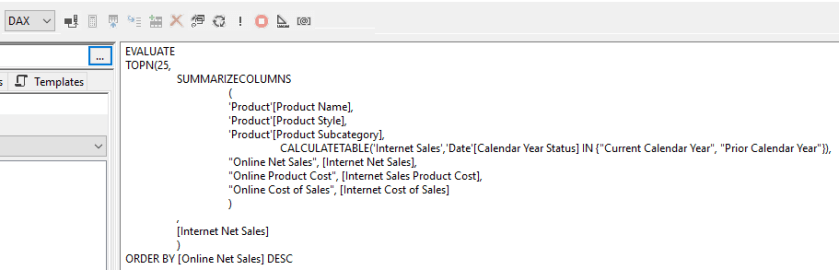
In addition to importing an MSDAX or DAX file, colorization and formatting of the DAX query in this window would be nice too.
- Add the dataset columns to a table including the Product Name column.
- From Design view, right-click the Product Name column and select Text Box Properties.
- Select the Action page of the Text Box Properties dialog.
- Configure the Go to report action as follows:

Per the above image, you just reference the target report as the ‘Go to report’, the parameter of the target report, and the value to pass to this parameter from the source report, all via dropdown.
User Experience of Drillthrough to Detail Rows
- The user opens the Top 25 report and, for some reason, want to see details of the Mountain-200 Silver, 38 product.
As the user hovers over the product name values, a pointer icon appears. (Unfortunately this icon is not captured in the image above).
- The user clicks the Product Name value: Mountain-200 Silver, 38
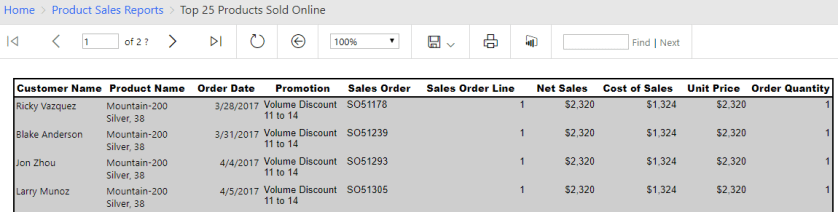
- Per the above image, two pages of details (at the sales order line level) are rendered from the target report (based on the DETAILROWS() query) specific to Mountain-200 Silver, 38.
As this is filtered to just one product, query performance is sufficient but of course this can vary based on your resources and data size.
Wrapping Up
The big picture of all this is that we want to leverage the detail rows expressions built into our Analysis Services models across all our MSBI report tools. The DETAILROWS() function simplifies DAX queries in implementing this reusability. This is both a development productivity issue and a version control issue.
Detail row expressions work out-of-the-box with Excel but this post and the previous post provide examples for paginated (.rdl) reports and Power BI reports, respectively.

One comment