Earlier this year at the Data & BI Summit I gave a presentation titled “DAX Query Use Cases” which, among other examples, featured several paginated reports (aka operational or Reporting Services reports) built against an Analysis Services Tabular model and deployed to the Power BI Report Server. Two main points I tried to make in this presentation were A) DAX queries are portable and reusable across many scenarios and apps and B) it’s fairly common to need to define a custom query or measure (or both) and persist this query logic (and possibly the data) outside the source data model.
Based on recent guidance from the Business Applications Summit as well as the October 2018 Release Notes, we now know that paginated reports (and thus DAX query based paginated reports) will soon be supported in the Power BI Service. Given this good news, and my general preference to avoid consecutive non-technical posts, I thought I’d walk through a DAX query to paginated report scenario.
Additionally, we also know that datasets hosted in Power BI Premium capacity will soon be available as data sources to paginated report authoring tools and other BI and model management tools just like Analysis Services via the XMLA protocol. Thus, for an organization that’s already using a Power BI dataset to support Power BI interactive reports and perhaps Analyze in Excel reports, this same dataset (one version of truth) could serve as the source for new paginated reports.
Requirements: Multi-Schema Query with Parameters
In the AdventureWorks sample database, there are two main sales fact tables – Internet Sales and Reseller Sales. Like most data warehouses, these fact tables both maintain relationships to common dimension tables such as Product, Date, and Promotion. However, the Customer dimension is exclusively related to Internet Sales while the Reseller dimension table is exclusively related to Reseller Sales.
The requirements for the new paginated report dictate a single dataset (which will support a single data region in the report) containing both online and reseller sales and the following user-defined parameter filters:
- Years of History
- Customer Country
- Product Category
- Reseller Business Type
The report should filter all previous years to only include the days through the current calendar day. For example, today (August 5th, 2018) is the 217th day of the year and thus any previous years in the report should be filtered for their first 217 days.
In short, we need to write a single DAX query which will filter both the Internet Sales and Reseller Sales schemas. Once the query is developed and tested in a tool such as SQL Server Management Studio (SSMS) or DAX Studio, a paginated report can be created in either Report Builder or SQL Server Data Tools (SSDT).
Note: This example assumes that an instance of Analysis Services Tabular 2016 (1200 CL) or later is available.
Two DAX Queries with Variables
It’s widely considered a good practice to use DAX variables in both measures and queries to improve readability and sometimes performance as well. The first query below uses nine (9) variables to split up the logic into smaller, more manageable components. The second query uses five (5) variables and embeds four filtered tables into the filter table parameter of the SUMMARIZECOLUMNS function.
Multi-Schema Query #1: Nine (9) DAX Variables
The first four variables will later be used to receive report parameter input values from the user of the paginated report. To develop and test the query in a tool such as SSMS, sample hard coded values (e.g. “Clothing) are used for these variables.
DEFINE
//User Parameter Selections
VAR YearsOfHistorySelect = 2
VAR ProdCatSelect = “Clothing”
VAR ResellerBusTypeSelect = “Specialty Bike Shop”
VAR CustomerCountrySelect = “Germany”
//Filtered Dimension Tables
VAR CurrentDayInYear =
LOOKUPVALUE(‘Date'[Day Number in Calendar Year],’Date'[Date],TODAY())
VAR DimDateParamTbl = CALCULATETABLE(‘Date’,
‘Date'[Day Number in Calendar Year] <= CurrentDayInYear,
‘Date'[Calendar Year] >= YEAR(TODAY()) – YearsOfHistorySelect)
VAR DimResellerParamTbl = CALCULATETABLE(‘Reseller’,
‘Reseller'[Reseller Business Type] = ResellerBusTypeSelect)
VAR DimProductParamTbl = CALCULATETABLE(‘Product’,
‘Product'[Product Category] = ProdCatSelect)
VAR DimCustomerParamTbl = CALCULATETABLE(‘Customer’,
‘Customer'[Customer Country] = CustomerCountrySelect)
//Report Query
EVALUATE
SUMMARIZECOLUMNS(
//Group By Columns:
‘Date'[Calendar Year]
, ‘Product'[Product Subcategory]
, ‘Promotion'[Promotion Type]
//Filter Tables:
, DimDateParamTbl
, DimResellerParamTbl
, DimProductParamTbl
, DimCustomerParamTbl
//Measures
,”Online Sales“, [Internet Net Sales]
,”Reseller Sales“, [Reseller Net Sales]
,”Ad Works Sales“, [AdWorks Net Sales]
)
ORDER BY [Ad Works Sales] DESC
Notice that four separate filter tables, in this case DAX table variables, are used in SUMMARIZECOLUMNS. Support for multiple filter tables is essential for scenarios like this with the need to filter multiple schemas.
Multi-Schema Query #2: Five (5) DAX Variables
In this alternative query, the logic of the four filter tables (via CALCULATETABLE()) is built into the filter table(s) parameter of SUMMARIZECOLUMNS rather than defined as their own table variables in Query #1.
DEFINE
//User Parameter Selections
VAR YearsOfHistorySelect = 2
VAR ProdCatSelect = “Clothing”
VAR ResellerBusTypeSelect = “Specialty Bike Shop”
VAR CustomerCountrySelect = “Germany”
//Report Query
VAR CurrentDayInYear =
LOOKUPVALUE(‘Date'[Day Number in Calendar Year],’Date'[Date],TODAY())
EVALUATE
SUMMARIZECOLUMNS(
//Group By Columns:
‘Date'[Calendar Year]
, ‘Product'[Product Subcategory]
, ‘Promotion'[Promotion Type]
//Filter Tables:
, CALCULATETABLE(‘Customer’,’Customer'[Customer Country] = CustomerCountrySelect)
, CALCULATETABLE(‘Product’,’Product'[Product Category] = ProdCatSelect)
, CALCULATETABLE(‘Reseller’,’Reseller'[Reseller Business Type] = ResellerBusTypeSelect)
, CALCULATETABLE(‘Date’,
‘Date'[Calendar Year] >= YEAR(TODAY())-YearsOfHistorySelect,
‘Date'[Day Number in Calendar Year] <= CurrentDayInYear)
//Measures
,”Online Sales“, [Internet Net Sales]
,”Reseller Sales“, [Reseller Net Sales]
,”Ad Works Sales“, [AdWorks Net Sales]
)
ORDER BY [Ad Works Sales] DESC
Which query to use for the report? Actually,…neither
The performance of the two queries above is roughly similar as reported via the tracing functionality of DAX Studio. Two high level performance points I look for in custom DAX queries is A) provide minimal grain required – there shouldn’t be many rows returned – don’t use DAX for ‘data extracts’ (aka ‘data dumps’) and B) the filters applied are not iterating over large tables. This query meets those two checks since it’s grouped at the year, subcategory, and promotion type level and there are simple filters applied against small dimension tables.
Four storage engine queries generated for each approach and there’s a slight hit due to CallBackDataID for the Date table filtering logic but performance tuning DAX queries is outside the scope of this post. Personally I prefer Query #2 for readability though I might start out with Query #1 just because it’s easier to troubleshoot queries and measures with the additional variables.
The problem, however, is that DAX variables are not currently supported in paginated report authoring tools (SSDT for Visual Studio or Report Builder). You currently receive the following error message when trying to use a DAX variable (either as a table or a scalar value):
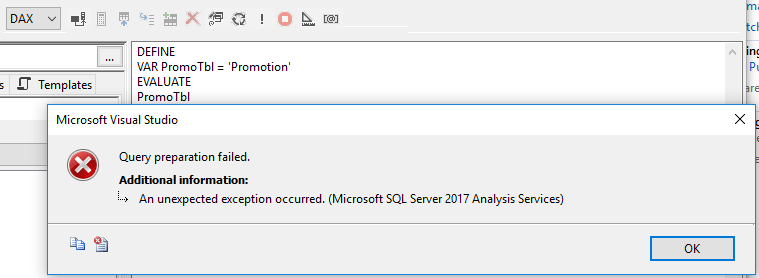
Note: This may be a temporary bug and specific to Analysis Services 2017 as a source. If the bug is resolved or you don’t encounter this issue with your version of Analysis Services, then the refactoring of the DAX variables described below is not relevant to your scenario.
What now?
One viable answer is to modify the second query to A) replace the five DAX variables with report-scoped measures and B) modify the filter table parameters to use these local measures. The measures can be set to the user’s parameter selections and the FILTER function can accept the DAX measures as its condition (unlike CALCULATETABLE).
Parameterized Paginated Report Query
In the following query from the paginated report dataset, the hard coded values from the earlier queries have been replaced with references to four report parameters. The report-scoped measures are then referenced by the four filter tables and specifically the FILTER function. (You can’t reference a measure directly by CALCULATE or CALCULATETABLE).
DEFINE
//User Parameter Selections
MEASURE ‘Adventure Works Sales'[YearsOfHistorySelect] = @YearsOfHistoryParam
MEASURE ‘Adventure Works Sales'[ProdCatSelect] = @ProductCategoryParam
MEASURE ‘Adventure Works Sales'[ResellerBusTypeSelect] = @ResellerBusTypeParam
MEASURE ‘Adventure Works Sales'[CustomerCountrySelect] = @CustomerCountryParam
//Report Query
MEASURE ‘Adventure Works Sales'[CurrentDayInYear] = LOOKUPVALUE(‘Date'[Day Number in Calendar Year],’Date'[Date],TODAY())
EVALUATE
SUMMARIZECOLUMNS(
//Group By Columns:
‘Date'[Calendar Year]
, ‘Product'[Product Subcategory]
, ‘Promotion'[Promotion Type]
//Filter Tables:
, FILTER(ALL(‘Customer'[Customer Country]),
‘Customer'[Customer Country] = [CustomerCountrySelect]), FILTER(ALL(‘Product'[Product Category]),
‘Product'[Product Category] = [ProdCatSelect])
, FILTER(ALL(‘Reseller'[Reseller Business Type]),
‘Reseller'[Reseller Business Type] = [ResellerBusTypeSelect])
, FILTER(ALL(‘Date’),
‘Date'[Calendar Year] >= YEAR(TODAY())-[YearsOfHistorySelect] &&
‘Date'[Day Number in Calendar Year] <= [CurrentDayInYear])
//Measures
,”Online Sales“, [Internet Net Sales]
,”Reseller Sales“, [Reseller Net Sales]
,”Ad Works Sales“, [AdWorks Net Sales]
)
ORDER BY [Ad Works Sales] DESC
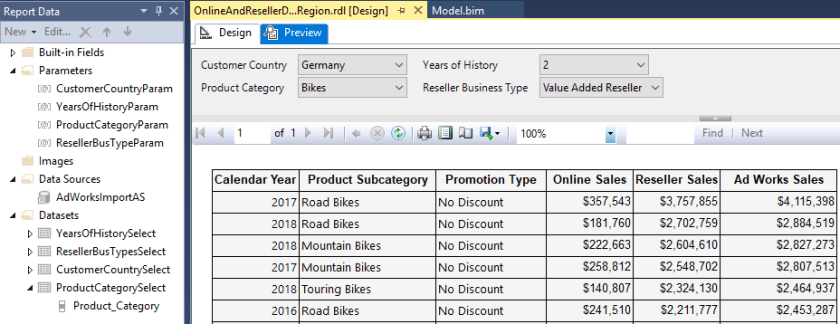
Paginated Report UI
Several other basic DAX queries are used in separate datasets to provide the list of available parameter values (e.g. Product categories) and the default values to use for these report parameters. With these queries and the main dataset query from the previous section, all that’s left is the formatting/design (header/footer, placement of parameters) and deployment.
It’s unclear if Microsoft will designate a particular paginated report authoring tool, such as an improved/modernized Report Builder, as the primary paginated report authoring tool going forward. There are higher priority needs at the moment but hopefully someday the paginated report authoring tool will work more seamlessly with DAX queries (I’d like to just load my query from a .msdax file) and maybe Power Query will be integrated as well.
A Few Takeaways
- Multiple DAX variables, some with table values, can be used in DAX queries to improve readability (and sometimes performance).
- You can use multiple filter tables within SUMMARIZECOLUMNS() to help address working with multiple schemas.
- You cannot use DAX variables (VAR) in your DAX queries for paginated reports.
- You can, in many cases, refactor a DAX query to replace variables with locally scoped DAX measures to provide a supported DAX syntax for the paginated report.
Next Week
The current plan for next week is to blog about Dataflows and their integration with Azure Data Lake and the Common Data Model. Consider subscribing if you want to be notified when the next and future posts are published.

The DAX variables issue affects SQL 2017 as a source but works fine with SQL 2016 so appears to be a bug.
I get around the variables issue by creating a dummy query without variables in Query Designer then edit the text of the query in the shared dataset to use my query with variables.
LikeLike
Thanks Chris – I’ve added a note below the error image.
LikeLike