Summary:
If you don’t read this blog post please just consider limiting your DAX metrics and queries to the specific columns and filter contexts required. Remember that the columns of your model are stored independently in memory and your goal is to scan the minimum amount of memory at run time as possible. This is especially true with larger models (think 1M+ row dimension tables) and more complex logic. (You can often get away with inefficient code at small scale and/or with optimal hardware.)
- Don’t retrieve a table of columns when a single column will suffice
- Don’t write iterating expressions against larger tables than you need
- Don’t be afraid to write metrics tailored for a specific need such as a dashboard
- Don’t stop thinking in terms of columns once the model is built – think in columns (and materialization) during query writing.
*This all assumes the model is already built and that modifying the model’s design, partitions, or anything at the server level (e.g. memory settings, RAM bandwidth) is outside of scope. Writing good, efficient DAX comes after good infrastructure and databases are in place but generally these upstream levers can’t be changed overnight whereas revised DAX usually faces much lower hurdles.
For a solid checklist visit the following: SQL BI
Background:
One of the first things you learn in querying relational databases via SQL is to avoid SELECT * statements. You should select only the columns needed for your query (often a fraction of the columns in the table) and thus greatly reduce the workload on the database server (e.g. spill to TempDB), the network and improve rendering performance. A related early SQL lesson is to avoid ORDER BY clauses unless required by the query – let the client tool handle presenting the results. A bit later on you learn (or should learn) that cursors are generally to be avoided as well – you should operate on ‘sets’ of data or if you absolutely must ‘iterate’ over individual rows of data you should look to ensure this row count is limited. Still further down the road you may have learned about indexes and how to write SQL that could take advantage of them.
This same common sense logic “don’t retrieve more than you need” is magnified in DAX metrics and queries in Power Pivot, Power BI Desktop, and SSAS Tabular (In-Memory Mode). Everyone knows that these tools store data in memory and most MSBI pros know they use the same xVelocity engine that stores data in a compressed, columnar format. However, this high level knowledge often doesn’t make it down into the details of the solution and this creates unnecessary performance bottlenecks.
Let’s remove the ‘in-memory’ and ‘compressed’ storage aspects for a moment and just focus again on columnar orientation vs traditional row storage. It’s absolutely essential in my mind, in both the design of models and development of metrics and queries to think of each column in an xVelocity model as its own ‘table’ structure as this is how the data is actually stored. Sure, you need to think in terms of the grain of the relationships between actual tables (with multiple columns) and sometimes de-normalizing (‘flattening’) a dimension column to a fact table is your best bet but there’s still a great deal you can control as a designer before the transfer of filter context across relationships takes place.
*A very similar ‘always be columnar’ mindset is required when writing SQL queries against clustered and nonclustered columnstore index for the same reasons.
DAX Examples
I’m choosing just one example here but the list could go on and on – RANKX and SUMX (other X iterators with table functions) would be good ones. The key is to always think through row and filter context and ask yourself if you’re reading more memory than you need to (and test, and read query plans :))
DAX Example: TOPN
Syntax: TOPN(<n_value>,<table>,<orderBy_expression>)
Who doesn’t want to have some ‘TOPN’ in their analytical models and reporting? Even if you don’t return TOPN directly to the presentation layer it’s often a part of the retrieval so you can’t forget about. Common metrics might be the sales for your top X customers or products or this metric as a % of overall customer or product sales.
TOPN requires a ‘table’ but you can pass in “any DAX expression that returns a table from where to extract the top ‘n’ rows.
So what you’ll sometimes see is the following:
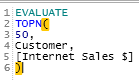 The developer says “Hey, I need the top 50 customers by Sales $, I’ll just use the Customer dimension for the second parameter…simple enough”
So what goes wrong?


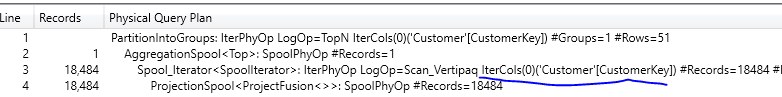
If you use DAX Studio you can see that 2,292,016 bytes were read and that the query touched every single column of the customer table (18,484 rows).
The query ran in 32 ms but remember this is only 20K customer rows, real world scenarios could have 200K to 2M+ customer rows (or product rows or vendor rows in some cases).
What’s a better alternative?
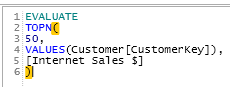
Instead of the entire customers table (all columns) you simply pass in a values function for the CustomerKey – the surrogate ID column that identifies the row and is used by the relationship to your fact table(s).
And the results?

This query executed in 20ms (30% better).
Notice that the storage engine query only read 147,896 bytes – 94% less than the original version. Why so much less memory? Because it only scanned one column per the physical query plan. Always be columnar!
A couple more examples I’d like to get to at some point include RANKX and SUMX.
With RANKX you want to avoid ALL(dimension) (if you can) in which the metric/expression is evaluated against a large table and instead use ALL(ColumnKey) or ALLEXCEPT(Table,Column1,2,3,4). These latter two approaches will allow some dimension columns to filter down your table before the iterating RANK function runs for each cell/value in the report.
In many cases the business prefers to see ‘ranking of what I have on screen’ rather than overall ranking and this should benefit performance as your ALL( ) table is smaller. SUMX, AVERAGEX, and other iterators have related considerations on the table you pass in.

thank you
LikeLike