The following Excel workbook available for download contains 10 report pages to describe primary components of SSAS Tabular 2016 databases at the 1200 compatibility level:
SSAS Tabular 2016 Metadata Reporting Download
How to use this file:
- Confirm you have an SSAS Tabular Database at 1200 compatibility level (and that you have access to it). The new Tabular DMVs are used as sources for these reports and are exclusive to 1200 CL. Older Tabular models from SSAS 2012-2014 (CL 1100-1103) cannot use these DMVs.

2. Identify the SSAS 2016 Tabular Server your database is deployed to and the name of the database.

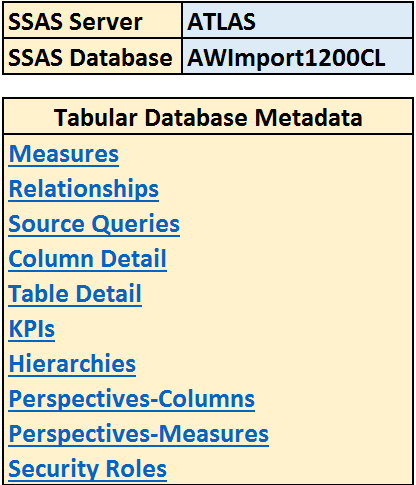
3. In the Excel file: A) ensure you’re able to edit the file you’ve downloaded B) enter the server name and database name in the light blue cells exactly as they appear in SSMS or SSDT per the example image above (ATLAS, AWImport1200CL) and then C) just click Data – Refresh All.


In a few seconds, the report pages linked from the Selection page should reflect your Tabular 2016 (1200 CL) database. You can use the links on the Selection page menu and the green arrow on the report pages to help navigate and the slicers can help focus a given report. The following images are from my sample Adventure Works database and are included in the Excel file.
Notes:
- The Excel workbook uses Power Query (built into Excel 2016) to retrieve and lightly transform/shape the DMV source data so you’ll need this installed on your machine. The queries take the values you enter for SSAS Server and SSAS Database and pass these into the M functions making it quick and easy to switch between databases and servers or have dedicated metadata reports for given databases and environments. (No VBA is used, just standard Excel and Power Query)
- If your Tabular database doesn’t contain or use certain components like KPIs or Perspectives the given report pages will just be blank.
- I consider this a solid ‘version 1.0’ metadata report solution. Additional enhancements I’ll probably add later this year include A) enable scheduled refresh by loading the data into the data model rather than the worksheets directly B) more metadata such as row counts (by table, partition) and database size and C) cleaner queries (M functions) with fewer steps and a staging layer of queries. I might also make a Power BI Desktop version available though I think Excel tables, for now at least, seem to be a preferred choice for detailed (many columns, lots of text) reports like this.
Use Cases
So why should you consider using this file or some version further customized to your preferences or needs?
- SSAS Tabular 2016 (1200 CL) databases, whether DirectQuery or Import (‘cached’) mode, hosted either on-premise or in Azure, will increasingly be at the center of BI projects and corporate BI environments. Power BI Desktop files will be migrated to Tabular models (with Power Query), new SSAS projects will likely start out in Tabular rather than Multidimensional, and I expect some organizations to choose to migrate existing Multidimensional SSAS databases to Tabular 2016+ to take advantage of various benefits and features such as common skills with DAX, Power BI migration, performance of in-memory and columnar compression, new features coming to Tabular in vNext, etc. Therefore, especially for large and complex databases (e.g. 4-5+ fact tables, hundreds of measures) it’s important to have quick and easy visibility to the essential contents of these databases in an integrated fashion without querying the different DMVs ad hoc in SSMS or opening up the project files.
- It’s not just BI teams that may benefit from something like this. Some business users, particularly Report Authors and power users familiar with the data and possibly DAX and modeling too, would appreciate a simple, familiar interface to help understand what’s in a given model and how it’s defined. If Excel Online is available such as with Power BI you could publish the workbook there and then, as questions arise from viewing various reports and dashboards (based on the SSAS Tabular database), you could simply click over to this report and walk through the relevant metadata (the source SQL, table relationships, DAX filtering logic, etc).
- Communication across teams, ongoing changes and iterations to SSAS models, and some level of ‘customer support’ is still a large part of BI. Having a sound metadata reference and repository can help explain what you can or can’t do with a given model, why you’re seeing the number or behavior you are with a given model, and optionally what’s been added or changed (or what’s in QA but not in Prod, for example).
Please let me know if you have issues or questions. As mentioned I’ll likely follow up later this year with more enhancements.

Hi , Thank you for the Excel model, this will be very helpfull.
I am trying to refresh the sheet using my own SSAS Server and Database but are getting the following error.
The import AnalysisServices.Database matches no exports. Did you miss a module reference?
Could you point in the right direction to solve this?
Thank You, Drickus
LikeLike
Hi Drickus, Did you enter your server name and database name in the light blue cells on the Selection page? The M/Power Queries used follow the pattern = AnalysisServices.Database(ServerSelection, DatabaseSelection) with these two parameters being populated by their own queries. From the Data tab in Excel 16′ you can go to Show Queries and right-click and Edit the ServerSelection and/or DatabaseSelection queries to identify which values are being passed into the DMV queries – the values come from the Selection page and must match your server and database exactly. You’ll also want to make sure you have rights to run the DMVs too – you might create your own query (“select * from $SYSTEM.TMSCHEMA_COLUMNS”) in a separate workbook with an explicit reference to your server and database to test you can run it. If you can run the DMV and you have updated Excel 16′ (with Power Query) you should be able to refresh the queries and metadata reports per the sample workbook with the correct server and database names entered.
LikeLike