Dynamic DAX Date Queries
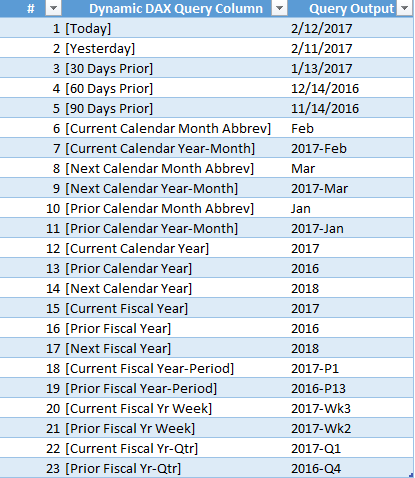
The following zip file contains two DAX queries that dynamically calculate 23 date dimension values. Both queries produce the same result set but one uses DAX Variables which are exclusive to SSAS Tabular 2016, Power BI Desktop, and Power Pivot for Excel 2016. The other query is backward compatible with SSAS Tabular 2012-2014.
Dynamic Dates via DAX Download
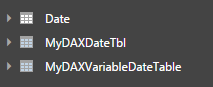
You can exclusively view the query syntax in the DAX files and view the source calendar dimension table in both the Excel file and the Power BI Desktop file.
Summary
Given that a high percentage of analytical queries reference different attributes of a date dimension and the relatively static nature of date dimensions it’s almost always a good investment of time to develop a robust source date dimension table (e.g. 50+ columns) and standard queries that leverage this table effectively. This approach can greatly simplify BI projects and improve the productivity and performance of BI solutions.
The date table should contain all primary granularities that lend themselves to hierarchies to drill down/up and user friendly names. Additionally, and most relevant for more advanced date intelligence queries, supporting columns should be included which enable queries to easily navigate and filter (e.g. trailing 4 periods) different attributes. This generally takes the form of a sequential integer (like an identity column) that increases with each dimension member – BI developers can author expressions that use these logical columns to implement various date range queries. (The sample calendar table has these sequential columns for Fiscal Yr-Qtr, Fiscal Yr-Period, and Fiscal Yr-Wk)
Use Cases
How could the attached DAX queries be used? (Why go through the trouble?)
- SQL Server Reporting Services (SSRS) – you could create a ‘shared dataset’ and/or use the query within individual reports to provide default parameter values. You could also pass values from the queries into your main dataset queries as filtering expressions. See a prior post on this topic for details.
- Power BI Desktop – per the attached PBI Desktop file you could you could create a calculated table via the DAX query. You could then use this table to feed DAX measures and/or parameters.
- SSAS Tabular – For SSAS 2016 models at the 1200 compatibility level, you could create a calculated table (like Power BI Desktop) and then integrate values from this table into your DAX measures. (Parameters will be supported in the next release of SSAS Tabular)
Of course you could also just use the query or part of the query or approach in a custom application that sources from an SSAS Tabular database. In a future blog post I’ll build on these queries to prove out some of these use cases.
Query Details
This post is already getting a bit long so I can’t go into great length about the syntax but, even if you have limited experience with DAX, they’re not that complex individually. The main approach is to determine the current date at query execution time via TODAY() and then to lookup different values from across the date dimension that would support navigating and filtering in other BI tools.
The LOOKUPVALUE() is used to retrieve the target value by comparing one column of the date dimension to a search value or expression. For certain columns such as Prior Calendar Year-Month a set of two column-value pairs is used within LOOKUPVALUE(). If multiple rows match the search condition and they’re identical this value is returned.
The DAX Variables approach/query, in my view at least, significantly simplifies the query for both authoring and interpreting. You simply declare and evaluate foundational variables up front once and then reference these variables in shorter, simpler expressions. With variables you avoid re-calculating the same value and the complexity of nesting DAX expressions together.
As always, please feel welcome to provide your feedback or experience with anything I share on this blog. There’s almost always an alternative and even ‘better’ method for achieving similar outcomes (e.g. not using LOOKUPVALUE(). At a minimum I hope this post and the follow up on use cases gives you some ideas and helps to avoid the pain/costs of trying to develop and support date/time intelligence ‘on the fly’ in each individual query or metric or relying solely on the out-of-the-box DAX time intelligence functions.

I am excited to have this work. Thank you. However, I am struggling to make use of the results in the variable table. I can see the correct values, but how does one then filter a CALCULATEd measure using the column value in the variable date table? In my case, I want to report this quarter and the next three quarters as distinctive values. I was trying to make a measure for “This Quarter sum” and another for “2nd Quarter Sum”, etc. but I can’t figure out how to use my 2019-Q1 or 2019-Q2, etc. value as a filter on the measure. Neither of these lame attempts worked. BTW, I have a 1:1 join between the Variable Date table and my Date table.
Open-Total Current Qtr = CALCULATE(‘_Open Measures'[Open-Total],’Variable Date Table'[Current Calendar Year-Qtr])
nor
Open-Total Current Qtr = CALCULATE(‘_Open Measures'[Open-Total],’Date'[Date]=’Variable Date Table'[Current Calendar Year-Qtr])
Thanks, in advance for any reply.
LikeLike