Three months ago the Dual KPI visual was announced and is available for download from the custom visuals gallery.
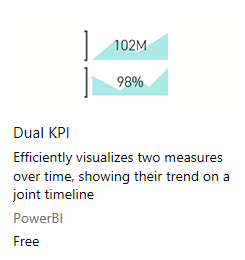
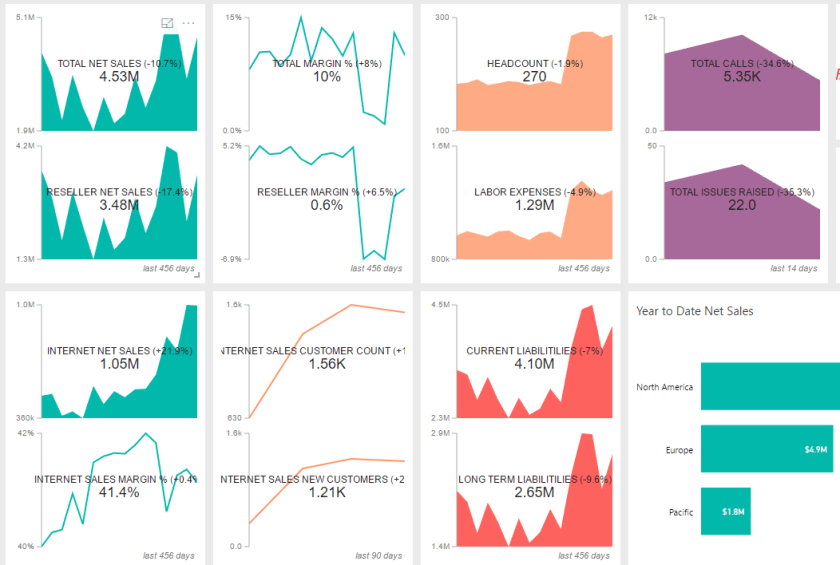
If you haven’t played with it yet you might give it a try as it offers much more than just an additional KPI and formatting options. For example you can set a ‘% change start date’ to compare the KPI against. In the Total Net Sales visual (top left) below you can see (-10.7%) because I’ve used a column that contains the first date of the current calendar year for this parameter. In January 2017 sales were about 5.1M versus the latest month of 4.5M – the visual includes 2016 data.
The visual is great for maximizing available dashboard canvas and often a single KPI isn’t useful unless a corresponding KPI doesn’t provide added context. (e.g. Prices went down but did Volume go up?)
However, unfortunately we can’t currently configure data driven alerts on this KPI. Alerts are limited to Cards, Gauges, and the standard KPI visual. Wouldn’t it be great if we could automate an email (via MS Flow) based on Dual KPI visual alerts like the standard visuals? If you agree, you should vote for this idea.
Note: As of 5/22/17 I’m able to view the dual KPI visuals in Google Chrome but not MS Edge. I haven’t tried other browsers.
