Update (9/26/17):
With the Power BI Desktop file open you can use DAX Studio to quickly find the server name you need to run the Profiler trace.
*Note that the PBIX file must be a dataset (Import or DirectQuery) – not a report with a live connection to an SSAS database or a published dataset in the Power BI service.
- Open the PBIX file
- Note that the PBIX file must be a dataset (Import or DirectQuery).
- When you’re only using PBIX to author a report connected to an SSAS database or a published dataset in the Power BI service an SSAS server is not associated with the open PBIX file
- Open DAX Studio
- Connect to the running PBIX file from Step 1

- Connect to the running PBIX file from Step 1
- Note the local host
- See lower right corner in DAX Studio:

- See lower right corner in DAX Studio:
- Open SQL Server Profiler
- Use the local host as the server

- Use the local host as the server
If you don’t use DAX Studio you could follow the steps from the earlier blog post below.
Here are the basic steps you can use to run a trace against a Power BI Desktop file.
- Download SSMS 17.0 Tools
- This is necessary to trace the SSAS 2017 instance (1400 compatibility level) running in the latest Power BI Desktop versions.
- Find the Process ID (PID) of the Power BI Desktop File
- Open Task Manager and find the PID associated with the msmdsrv process
- See the Details Tab in Windows 10
- Open Task Manager and find the PID associated with the msmdsrv process

- If you have multiple Power BI Desktop files open or SSAS instances running on your local machine you’ll see additional processes
- Find the Port being used by the Process ID
- Open the command prompt and enter netstat -anop tcp
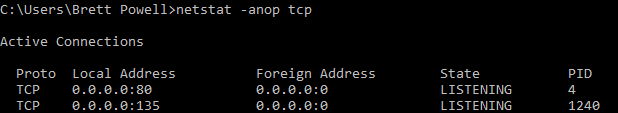
- The port is under the Local Address column for the SSAS PID
- Run the Trace from Profiler 17′

- Server name: localhost:
- Capture session details from PBI Desktop Queries
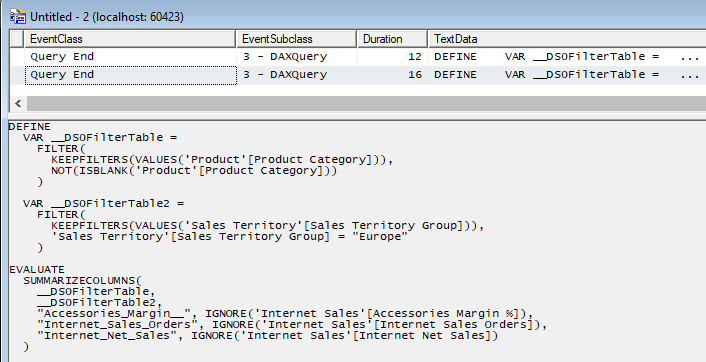
- For example, observe how Report and Page filters are converted into DAX variables and the (relatively) new DAX functions are used such as SUMMARIZECOLUMNS().
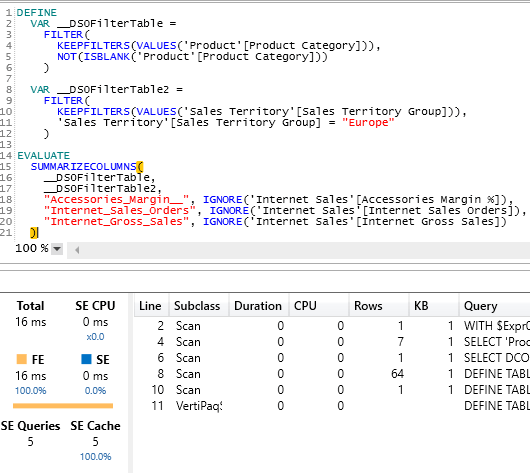
- To go a step further with analysis, copy the DAX query from the Query End Event into DAX Studio.
- Connect DAX Studio to the PBI Desktop file
- Which events to include in the trace or trace template and how to use/analyze the data is outside the scope of this blog post but tracing Power BI Desktop is a great way to understand how features and functionality (e.g. new slicers, new functions) are executed.
