The Situation: First Purchase Date
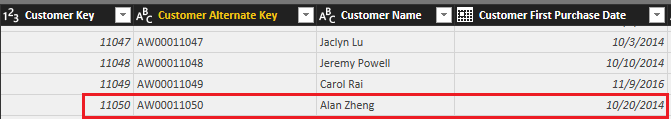
Your customer dimension table has a column (attribute if you prefer) for the date of the first purchase for the given customer. For example, we know that Alan Zheng’s first purchase was on 10/20/2014:
As you would expect, this column is of great interest to business and data analytics teams. However, since there are many distinct date values, the column isn’t quite as useful as it could be. For example, the business wants to analyze current or new customers versus customers with multiple years of purchase history. In other words, the customers need to be grouped in some form or another based on the first purchase date column.
Option 1: Year Groups
A very quick, no code option is to use the Groups feature of Power BI Desktop. Simply set the bin size of the groups to one year and you’ll have a new column that groups (bins) the customer rows into years.

You would first select the column in the Fields list and then click ‘New Group’ from the Modeling tab.
Option 2: Year Column
Another no code option is to add a year column from the Query Editor:
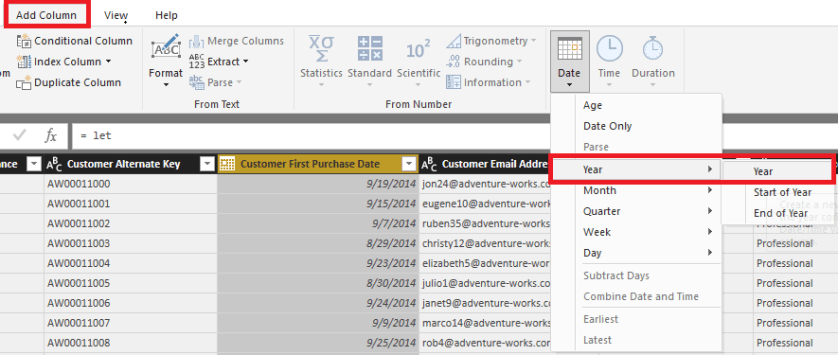
Power BI will simply translate your mouse click into a new variable for the Customer M query that contains the Table.AddColumn() function, which itself contains the Date.Year() function.
Option 3: Dynamic Customer History Segmentation
The first two options are ‘quick and easy’ and maybe they’re sufficient to at least get started. However, let’s say you need to provide a more custom, dynamic solution that identifies first year customers, second year customers, legacy customers, etc and you don’t have the time or the resources to build this logic into your source database or any corporate ETL tool or process. (I’ll talk about this issue more another time, it’s a great conversation).
- By ‘first year customers’ we mean customers with a first purchase date that’s later than or equal to one year ago from the current date. (The current date will of course change as the dataset is refreshed over time)
First, here are the results with a dynamic customer history segment column:
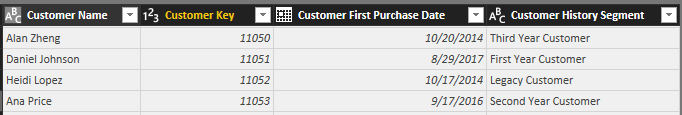
Alan Zheng is identified as a Third Year customer because the query was refreshed on 10/19/2017. At that time, he was at the end of his third year having first purchased on 10/20/2014. When the query is refreshed on 10/23/2017, for example, Alan Zheng will become a ‘Legacy Customer’ – a customer that first purchased more than three years ago.
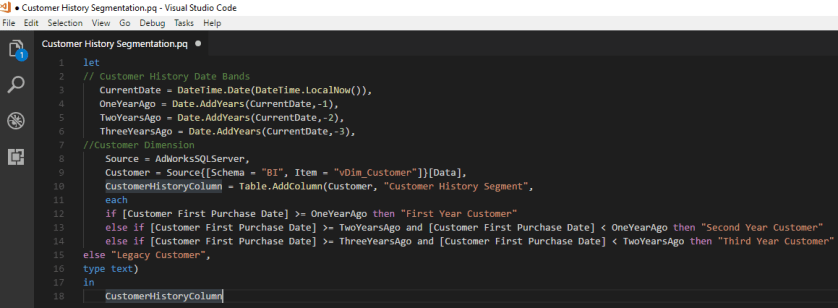
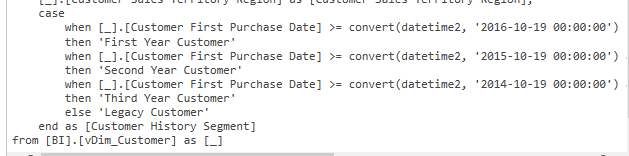
Here’s the M query that added the Customer History Segment column to the customer dimension table:
- If M query editing in Visual Studio Code is new to you, here’s a short blog post to get started.
Note that this M query is completely (100%) translated into a SQL statement and executed by the source database via Query Folding. The View Native Query dialog reveals that the date variables and conditional logic of the new column was translated into a standard CASE expression:
As always, it’s one thing to meet a functional requirement for a new column or measure and something entirely different to implement this logic in a way that scales and that can be supported. You may notice, for example, that I don’t recognize a DAX calculated column as a serious option (even if the customer table is small).
How it works
- Compute the current date (at the time of query execution)
- Based on this variable, compute three other dates (one year ago, two years ago, three years ago)
- Within the Table.AddColumn() function, use conditional logic to compare the Customer First Purchase Date column against the date variables from Step 2.
- For this example, we test for first year, second year, and third year customers and then assign all other customers to the ‘Legacy Customer’ segment
- The AdWorksSQLServer reference (the Source variable) is explained in the data source staging post.
Summary
To some of you, this customized customer history column is very straight forward. To others, it may seem foreign or complex and you’d want to handle something like this directly with SQL or an ETL tool. M queries don’t replace these alternatives but if you invest just a little time I think you’ll find that many scenarios like this as well as more complex data transformation processes can be handled fairly easily and efficiently.
I should have time at Boston Code Camp 28 to review this query or the general pattern. Additionally, if you’re interested in a deep mix of example queries like this and supporting concepts you may consider my Power BI books.

Hello Brett, thank you for the post. Nice view on this recurring theme. One drawback of your method is that the binning, although dynamic relative to the refresh date, is static relative towards the filter context of the report. For example if I would like to compare the ‘1st-year’ customers trend you can’t do it with this approach. If my strategy was to gain new customers, I would like to visualize this hopefully upward trend, which is only possible through a DAX measure, if I’m not mistaken.
LikeLike
Hi Wouter, thanks for your kind note. Yes, the first two options are not truly dynamic by any reasonable definition. At first I thought I’d only include the custom M query but I wanted to at least mention two very lightweight ‘getting started’ options that at least correlate to the problem we’re trying to solve. I tried to explain this in the blog but probably could’ve been more clear. Regards, Brett
LikeLike