Detail Row Expressions
Detail row expressions is one of the top new features of Analysis Services 2017 (1400 Compatibility Level) as it provides the equivalent of a drillthrough action for users to quickly view a custom row set comprised of columns and expressions relevant to a specific measure given the current filter context of the report. In many cases the columns included in detail row expressions are hidden from the fields list or are spread across several dimension tables and thus detail row expressions can be highly valued by the users of Tabular models.
Currently detail row expressions are not available to DAX client tools like Power BI. Nonetheless, if you’re taking advantage of this feature it probably makes sense to update model documentation to include both the default detail row expressions defined at the table level and the detail row expressions specific to individual measures.
Update DAX Measure Documentation
The purpose of this blog post is to describe the integration of detail row expressions into tabular model documentation. The end result is a table in a Power BI report at the grain of an individual measure with both the detail row expression for the measure (if it exists) and the default detail row expression for the table of the measure (if it exists).
Use Cases
Particularly with larger and more complex models, there’s often the need to quickly understand the logic built into DAX measures, including the expressions themselves. Adding and documenting descriptions of measures and columns is helpful but there’s no such thing as descriptions for detail row expressions. Additionally, a BI team and potentially other stakeholders would want to know which measures have their own detail row expression and which columns are included in these expressions.
At some point in the future, it may not be necessary to build integrations on top of the Analysis Services DMVs. An out-the-box Power BI Solution Template may be created to help document and analyze the metadata of Tabular models. Alternatively, a third party or someone in the MSBI community may create a robust metadata documentation tool and make it available for free. However, once you’ve established the basic data retrieval components (e.g. Parameters, DMV queries) it becomes straight forward to maintain and extend your own model metadata reporting.
Detail Rows Metadata Reporting
The following image from the Query Editor in Power BI Desktop includes several sample M queries including queries which access the TMSCHEMA_DETAIL_ROWS_DEFINITIONS DMV:
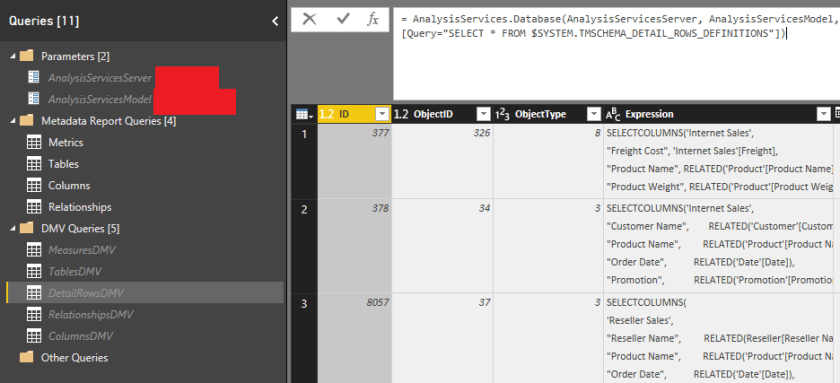
Per the DetailRowsDMV query, two parameters (server and database) are passed to the AnalysisServices.Database() function and a SELECT * query exposes the columns of the given DMV. The DMV Queries are not loaded to the data model per the gray font – they’re only staging queries which can be referenced by the Metadata Report Queries.
Detail Row Expression Retrieval
There are two options to retrieve the detail row expressions:
-
-
- Join the DetailRowsDefinitionID column from the Measures DMV and the DefaultDetailRowsDefinitionID column from the Tables DMV to the ID column of the Detail Rows Definitions DMV in separate join expressions.
- This implies a join from the Measures DMV to the Tables DMV to obtain the DefaultDetailRowsDefinitionID column.
- Join the ID and TableID columns from the Measures DMV to the ObjectID column of the Detail Rows Definitions DMV in separate join expressions.
- Join the DetailRowsDefinitionID column from the Measures DMV and the DefaultDetailRowsDefinitionID column from the Tables DMV to the ID column of the Detail Rows Definitions DMV in separate join expressions.
-
Given that you likely need to join Measures to Tables to retrieve the table name and possibly other table columns, I’m using the first approach in this example. (Note: You cannot join the DMVs directly via SQL)
The following M query implements three joins to produce a metrics table with the detail row expressions and the default detail row expressions for the table:
let
//Measures and Table
 MeasureTableJoin = Table.NestedJoin(MeasuresDMV,"TableID",TablesDMV,"ID","TablesColumns",JoinKind.Inner),
 TableName = Table.ExpandTableColumn(MeasureTableJoin,"TablesColumns",{"Name", "DefaultDetailRowsDefinitionID"},{"Table Name", "DefaultDetailRowsID"}),

//Add Detail Rows Expressions (Measures)
 DetailRowsJoin = Table.NestedJoin(TableName,"DetailRowsDefinitionID",DetailRowsDMV,"ID","DetailRowsColumns",JoinKind.LeftOuter),
 DetailRowsExpression = Table.ExpandTableColumn(DetailRowsJoin,"DetailRowsColumns",{"Expression"},{"Detail Rows Expression"}),

//Add Default Detail Rows Expressions (Table)
 DefaultDetailRowsJoin = Table.NestedJoin(DetailRowsExpression,"DefaultDetailRowsID",DetailRowsDMV,"ID","DetailRowsColumns",JoinKind.LeftOuter),
 DefaultDetailRowsExpression = Table.ExpandTableColumn(DefaultDetailRowsJoin,"DetailRowsColumns",{"Expression"},{"Default Detail Rows Expression"}),

//Additional Transformations
 RenameCols = Table.RenameColumns(DefaultDetailRowsExpression,{{"Name", "Measure Name"}, {"Description", "Measure Description"}, {"Expression", "DAX Expression"}})
in
 RenameCols
- Note that left outer joins are used in the joins to the DetailRowsDMV staging query.
Detail Row Report
At the report level, the two detail row expression columns could be added to a table visual per the following image:
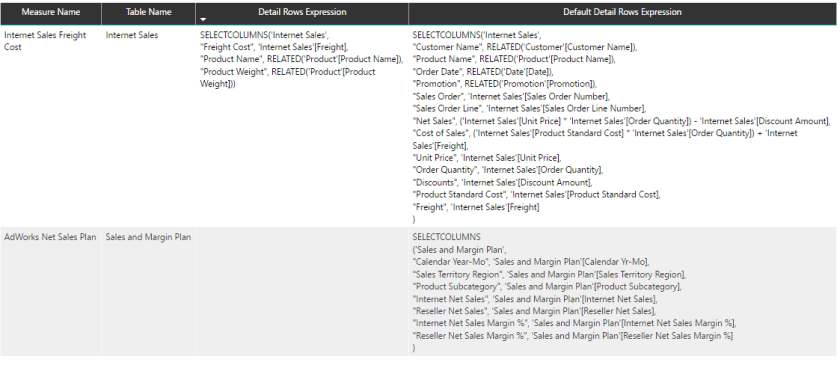
In this sample, the Internet Sales Freight Cost measure has its own detail rows expression whereas the default detail rows expression for the Sales and Margin Plan table is used for the AdWorks Net Sales Plan measure. A slicer visual could be added to the report page to filter the measures (and thus the detail row expressions) by their table.
Wrapping Up
With detail row expressions, there are now (Analysis Services 2017, 1400 Compatibility Level) three DAX expressions to be aware of and to include in documentation. Once a default detail rows expression has been defined for a table, a next step is to identify which measures deserve or require their own detail rows expression.
The next 1-2 blog posts will look at methods of utilizing the detail rows expressions outside of the typical Excel pivot table scenarios.

One comment