Two of the most fundamental and ongoing questions in BI are 1) “What data and logic do we need in the data model?” and 2) “What data and logic do we currently have in the data model?” Obtaining clear and complete answers to these questions in order to efficiently close the gap between the business need and the current state is often difficult, especially at scale, mainly due to the distributed (and ‘tribal’, undocumented) knowledge and the risks of miscommunication. It’s well understood that self-service BI and even a properly governed, IT-managed, self-service BI environment doesn’t fully eliminate this issue.
With this in mind, any tool which even slightly raises the productivity of a model author or an IT/BI team responsible for the data model can be meaningful. For example, the dynamic management views (DMVs) for Analysis Services models contain rich metadata of Power BI and Analysis Services models (i.e. current state) yet many important columns are stored as surrogate key values (e.g. Data Type = 6). Additionally, joins between the DMVs, which are essential for most common analyses (e.g. Tables to Columns), are not supported.
(Where the data represented by the model will be stored and processed and how the BI content will be accessed and distributed are of course also fundamental and, to an extent, ongoing questions as well. These decisions are outside the scope of this post.)
Tabular Model Schema Reference
The following Excel workbook contains M queries (Power Query) which access, integrate, and extend the schema-oriented tabular model DMVs:
Tabular Model Schema Reference
See the v1.1 update post for the new version.
Several of the queries are loaded as data tables to distinct worksheets and these sheets are linked to the following sheet:
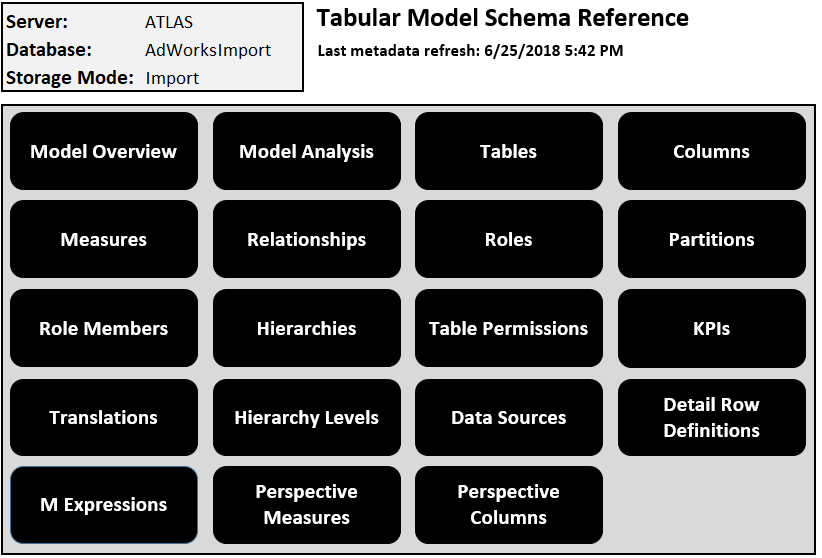
None of the queries are loaded to the Excel data model and thus there are no DAX measures in the workbook. With simplicity and ‘reference doc’ as the aim (not visualization or data science), only a handful of basic Excel functions are used on the Model Overview page and each sheet follows a simple layout with optionally one or a few slicers:
Given the Prerequisites and Getting Started steps described below, using this reference document is as simple as defining the server and database parameters in the Query Editor (Power Query) interface and clicking Refresh All from the Data tab. Before you retrieve the metadata for your tabular model of choice, I’d recommend browsing the workbook and reading through this post (thinking of use cases while you do) and reading through this post.
Models Supported
- 1400 Compatibility Level Tabular Models
- Azure Analysis Services
- SQL Server Analysis Services 2017
- Power BI
Almost all of the queries will fail if you connect to an SSAS 2016 (1200CL) model.
Common Use Cases
- Quick answers to simple, summary level questions:
- Which tables, measures, and columns are included?
- How many measures?
- If import mode, what’s the row (and partition) count by table?
- What data source(s) are used by the model?
- What modeling features are we using or not using?
- Several 1400 CL features are not available to Power BI models at this time such as display folders, perspectives, KPIs, and detail row expressions.
- Which tables, measures, and columns are included?
- Quick answers to granular, technical questions:
- How are the relationships defined (which columns, single or bidirectional crossfiltering)?
- Which database roles and table permission expressions (row-level security) have been applied?
- Are their calculated columns in the model? If so, where are they?
- What M (Power Query) expression is being used for table X or partition Y?
- Have data transformations been embedded within the model?
- Which columns are included in our detail row expressions?
- Have encoding hints been applied and for which columns?
- Project Planning
- In a team project or sprint planning meeting, it’s determined that database role A will be added and/or that database role B’s permissions need to be revised and a new security group members should be added.
- In a meeting with a self-service report author, the model owner(s) are able to quickly explain what logic has been built into the KPIs and DAX measures used for reports.
- A BI consultant or new team of developers join a project and use the schema reference to quickly learn about the data model
The objects of a Tabular model work together to drive user experience and model behavior and thus it’s important to be able to quickly navigate between these objects. For example, a KPI question/issue leads you to the DAX expression logic of its base measure which may lead you to the relationships of tables and/or the DAX expressions of other measures. The Tabular Model Explorer in SQL Server Data Tools, as its name implies, does provide a quick metadata browsing experience but, I find anyway, there’s an advantage in having a simple tabular layout by object member rather than looking through properties windows and dialog boxes in Visual Studio or searching the JSON of the model’s .bim file.
Prerequisites
- Administrative permissions to a tabular model at 1400 compatibility level.
- If you have the Power BI Desktop file (the actual dataset, not a Power BI report with a live connection to a model), then you’ll just need to obtain the server and database parameter values as described in the Getting Started.
- For Azure Analysis Services and SQL Server Analysis Services 2017 models you can quickly test your access by trying to query a DMV from a client tool such as DAX Studio (“SELECT * from $SYSTEM.TMSCHEMA_TABLES”)
- Get Data in Excel 2016 and Office 365 or Power Query for Excel
- The AnalysisServices.Database() function is used by the M queries (not the AnalysisServices.Databases() function).
- You can check if you have this function by referencing it from a blank M query (“= AnalysisServices.Database” in the formula bar)
Getting Started
- Configure privacy level settings in Excel.
- From the Data tab, go to Get Data and then select Query Options
- Set the global privacy level to “Combine data according to each file’s Privacy Level settings”
- Set the current workbook privacy level to “Ignore the Privacy Levels and potentially improve performance.”
- If it’s necessary to revise the global privacy level setting you’ll need to click OK and then come back to the Query Options dialog to set the Current Workbook option.
- Formula.Firewall error messages encountered are due to privacy/isolation level settings.
- From the Data tab, go to Get Data and then select Query Options
- Obtain the server and database.
- For SSAS 2017 models, if you don’t already know these values you can connect via SQL Server Management Studio (SSMS) or another other tool.
- For Azure Analysis Services models, access the Azure AS resource in the Azure portal and copy the Management Server Name.
- If the server is running, the name of the model will be visible on the Overview page and this value can be used for the database.
- You could also connect to the Azure AS server from SSMS just like SSAS to obtain the database.
- For Power BI models, open the Power BI Desktop file and connect to it from DAX Studio.
- The localhost value on the status bar at the bottom (e.g. localhost:63390) is the server.
- In a query window, run “select * from $SYSTEM.DBSCHEMA_CATALOGS”
- The long character string for the Catalog_Name column is the database.
- Modify the server and database parameter values.
- From the Data tab, click the Get Data dropdown and then ‘Launch Query Editor’.
- Enter or paste the server and database values into the Current Value input boxes for the parameters as follows:
-
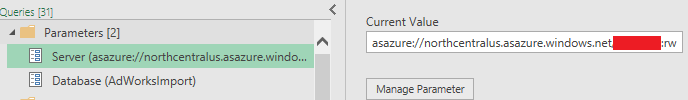
Query Parameters: Azure AS Model
- Click the Close & Load icon from the Home tab.
- Finally, click the Refresh All icon from the Data tab.
- You may be prompted to authenticate such as with your organizational Azure AD account for Azure AS models or with your Windows credentials for a Power BI Desktop file.
- The status bar in Excel should say ‘Running background query..’. and, particularly if Fast Data Load is enabled (a Global Data Load property), Excel may be unresponsive for several seconds while the queries are executed and loaded.
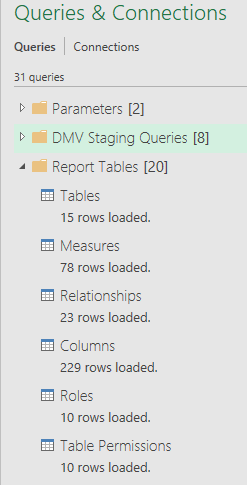
You can open the Queries and Connections pane via the Data tab to validate there are no errors per the following image:
The Schema Overview page (in the slideshow above) gives you a quick count of each object member. For Power BI models, you’ll have a zero for Detail Row Definitions, KPIs, M Expressions, Perspective Columns, Perspective Measures, and Role Members (since these are defined in the Power BI service).
To further test out the retrieval process, you might implement a few small changes to your data model (e.g. new measure, a column description, etc) and then click Refresh All again. If you successfully deployed these changes to your server, the change should be reflected on the respective metadata page.
If you have multiple models that you work with regularly, you might save separate schema reference files connected and dedicated to each tabular model so you don’t have to modify the server and database parameters. Just remember that with Power BI Desktop files the server and database values will change and you need to have the PBIX file open to connect/query. The ability to connect to the Analysis Services server underlying a dataset in a Power BI Premium workspace should address this issue.
Additional Details
- Many of the DMV columns are excluded/removed from the metadata tables because either A) they don’t seem to be necessary or B) their meaning is unclear and undocumented.
- A sequential Index ID column is added to each report table.
- The ID columns from the DMVs have gaps and thus an index column is added following a sort operation such as by table name. This groups the rows together.
- Since the DMVs are the only data source and Excel tables are the only output there are a number of transformations (e.g. remove column, reorder column) you wouldn’t normally use or recommend.
- Unlike other sources, we can be fairly confident that A) the source columns won’t change or be removed and B) we’re working with very small tables
- Outside of row and partition counts, performance related analysis (e.g. dictionary size, memory usage) is its own separate tool that does involve loading DMVs to a data model and writing DAX measures.
- FYI-Column-level security has been applied to the Sales and Margin Plan table.
- This is why it appears on the Table Permissions page despite having table metadata permissions and no table filter expression.
Wrapping Up
I hope you find this useful and don’t encounter issues getting started. The next blog post will either be “Origins of Data Model Anti-Patterns” or a post regarding object level security in Analysis Services 1400 CL models.

One comment