The Tabular Model Schema Reference document introduced a couple weeks weeks ago has been uploaded to a GitHub repository and updated (v1.1) with the following small improvements:
- Refresh button
- New Measure Attributes: Contains Iterator, Contains Variable
- Reorganized Home page

GitHub Repo
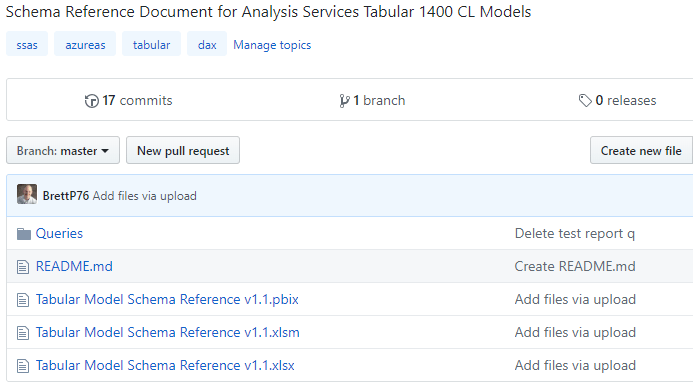
The Tabular-Schema-Reference repository includes the primary report file (Tabular Model Schema Reference v1.1.xlsm), an .xlsx (macro free) version, and the Power Query (.pq) files containing the M expressions used in the reference docs. Be advised if you use the (.XLSX) file that the four charts on the Model Analysis need to be refreshed on their own after you execute a Refresh All. This issue will be addressed in v1.2.
Additionally, a Power BI Desktop file (.PBIX) with the same queries is also included. This file does not contain any visualizations, DAX measures, relationships, hierarchies, etc. I don’t currently plan to build any of this content in Power BI Desktop but will update the PBIX file with new source queries.
v1.1 Improvements
Data Refresh
In general I didn’t want there to be any macros/VBA, DAX, or imported data model to keep the reference file as simple as possible. However, when you don’t work with Excel regularly or when you need to refresh multiple times in a session this could be a convenience.
In addition to the refresh macro, a RefreshPivots macro is called when the Schema Analysis worksheet is opened. This keeps these charts aligned with the latest data retrieval.
Perhaps an even better refresh approach would be to allow the user to enter the server and database input parameters into the Home page worksheet. Currently the Server and Database query parameters must be modified in the Query Editor (Get Data → Launch Query Editor) .
New Measure Attributes
Tabular models often contain hundreds of DAX measure expressions and these expressions can vary dramatically in complexity. The original schema reference file included an attribute (DAX Length Category) that broke out the length of the measure’s DAX Expression into one of 5 categories.
In this release, a Contains Iterator and a Contains Variable attribute have been added to the Measures report page to make it easier to identify measures which may contain complex logic or which potentially represent a performance issue. (Clearly there are many simple and performant DAX measure patterns which use iterators and/or variables – these new attributes just help provide clues to aid the model analysis process. At a minimum, you now know whether the model is using DAX variables at all and you can quickly focus your analysis on the longer measure expressions which contain iterators).
For now, the Contains Iterator attribute flags measures when utilize the FILTER function or one of the X iterator functions (e.g. SUMX) as TRUE. Likewise, the Contains Variable attribute identifies measures which utilize the VAR function.
Rather than explicitly search for the full function name (and each casing) for the many different iterators, the ‘X’ letter is used as the search criteria. Therefore, certain measures which reference tables or columns containing ‘X’ or other DAX functions containing X will be falsely flagged. This issue will be addressed in v1.2.
Reorganized Home page
The shapes on the Home page are now more logically positioned next to similar objects. For example, Roles, Role Members, and Table Permissions are all next to each other on the fourth row. The most commonly used pages (e.g. Overview, Measures, Tables) are positioned toward the top and left.
A Look Ahead
I probably won’t release a v1.2 for at least 4-5 weeks as there are several other blog posts I’m interested in writing. These include “Origins of Data Model Anti-Patterns”, implementing object-level security in Tabular 1400 CL, and maybe a post regarding the relatively new IsAvailableInMDX property. (Note: The Schema Reference v1.1 supports this property on the Columns page.)
v1.2 will very likely include a source-target document that maps the report columns back to the Analysis Services DMVs. This work has already been started. Additionally, though I don’t want to go too far down the performance optimization path, there may be some support for column cardinality and memory usage. The combination of this new metadata along with existing information on the measures and relationships could assist performance troubleshooting scenarios.
As mentioned before, I usually don’t promote blog posts on social media. Therefore, you need to follow (Subscribe → Follow) this blog for notifications of new posts.

Great!
LikeLike
Thanks Tim
LikeLike
That’s simply amazing Brett.
LikeLike