Today I’m pleased to share a rebuilt Tabular Model Schema Reference – now a Power BI-based tool designed to assist with the analysis of Tabular models from a model authoring or design perspective.
You can download the Power BI Template (.PBIT) from the following GitHub repository: Tabular Model Schema Reference v2.0
In addition to SSAS Tabular and Azure Analysis Services Tabular models, thanks to XMLA connectivity, you can use this tool against Power BI datasets provided that the dataset is hosted in Power BI Premium capacity.
Getting Started
Once you’ve downloaded the template (.PBIT), you’ll be prompted to enter the name of the server and database per the following image:
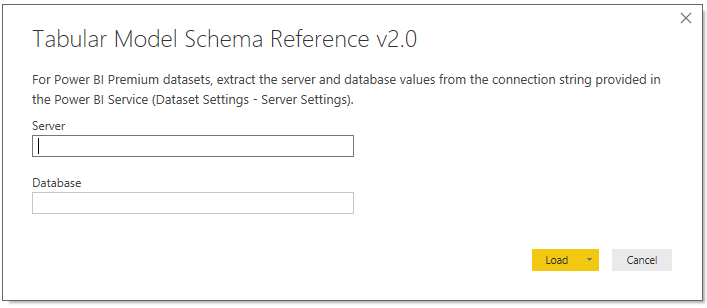
The Schema Reference queries Analysis Services Dynamic Management Views (DMVs) which require server admin permissions on the instance. Therefore, and this is specific to Azure AS and SSAS, if you’re not a server admin you’ll need to request a server admin to run the schema reference on your behalf.
Note: You can disable the ‘Require user approval for new native database queries’ option in Power BI Desktop (Options – Global – Security) to avoid the approval prompts.
If you’re trying to run this against a Power BI dataset hosted in premium capacity, make sure you’re mapped to a workspace role of admin, member, or contributor for the workspace containing the dataset.
Just click ‘Load’ or hit ‘Enter’ on the keyboard once you’ve provided the two required parameter values. Depending on the source, you may be prompted to sign in. For example, with Azure Analysis Services, you’ll need to sign in with your Microsoft account as Azure AS uses Azure Active Directory for authentication. Once authenticated, the queries themselves are quick to execute as they’re only retrieving small metadata tables.
In the case of Power BI Premium datasets, as advised by the template description, you can just navigate to the Dataset Settings page in the given app workspace and, based on the connection string provided in the Server Settings property, extract the server and database values. (The server is essentially the app workspace and the database is the name of the dataset)
For local Power BI datasets (PBIX files with data or a model, not live connection report files), an easy way to get the server and database values is by connecting to the open file from DAX Studio. The server is the ‘localhost’ value in the bottom right of the status bar and the CATALOG_NAME attribute of the DBSCHEMA_CATALOGS DMV can be used as the database.
A Quick Tour
The following slideshow gives you a general idea of the tool from a front end or user perspective:
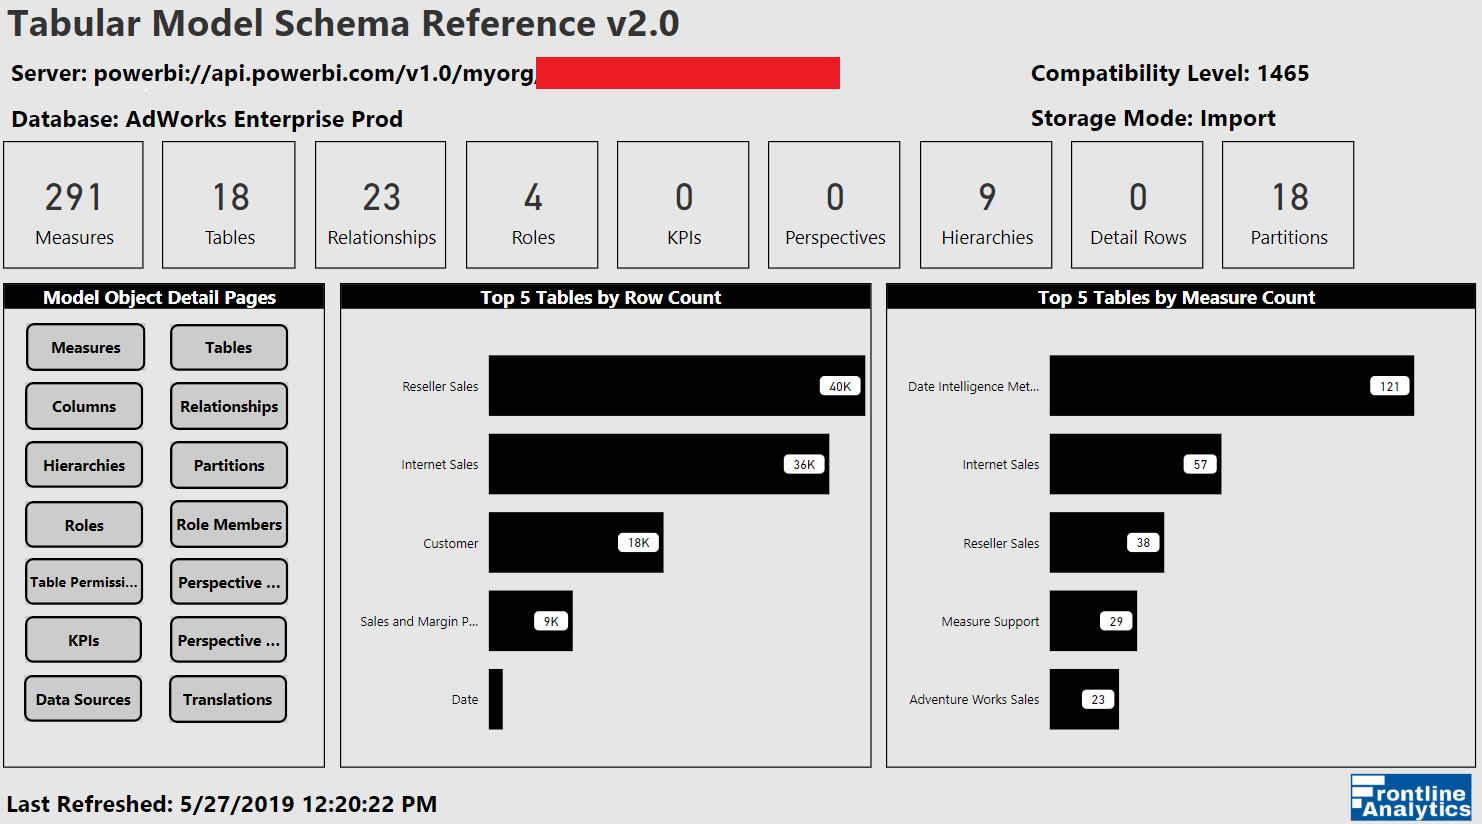
Model Summary: Power BI Premium Dataset (XMLA) 
Model Summary: Azure Analysis Services 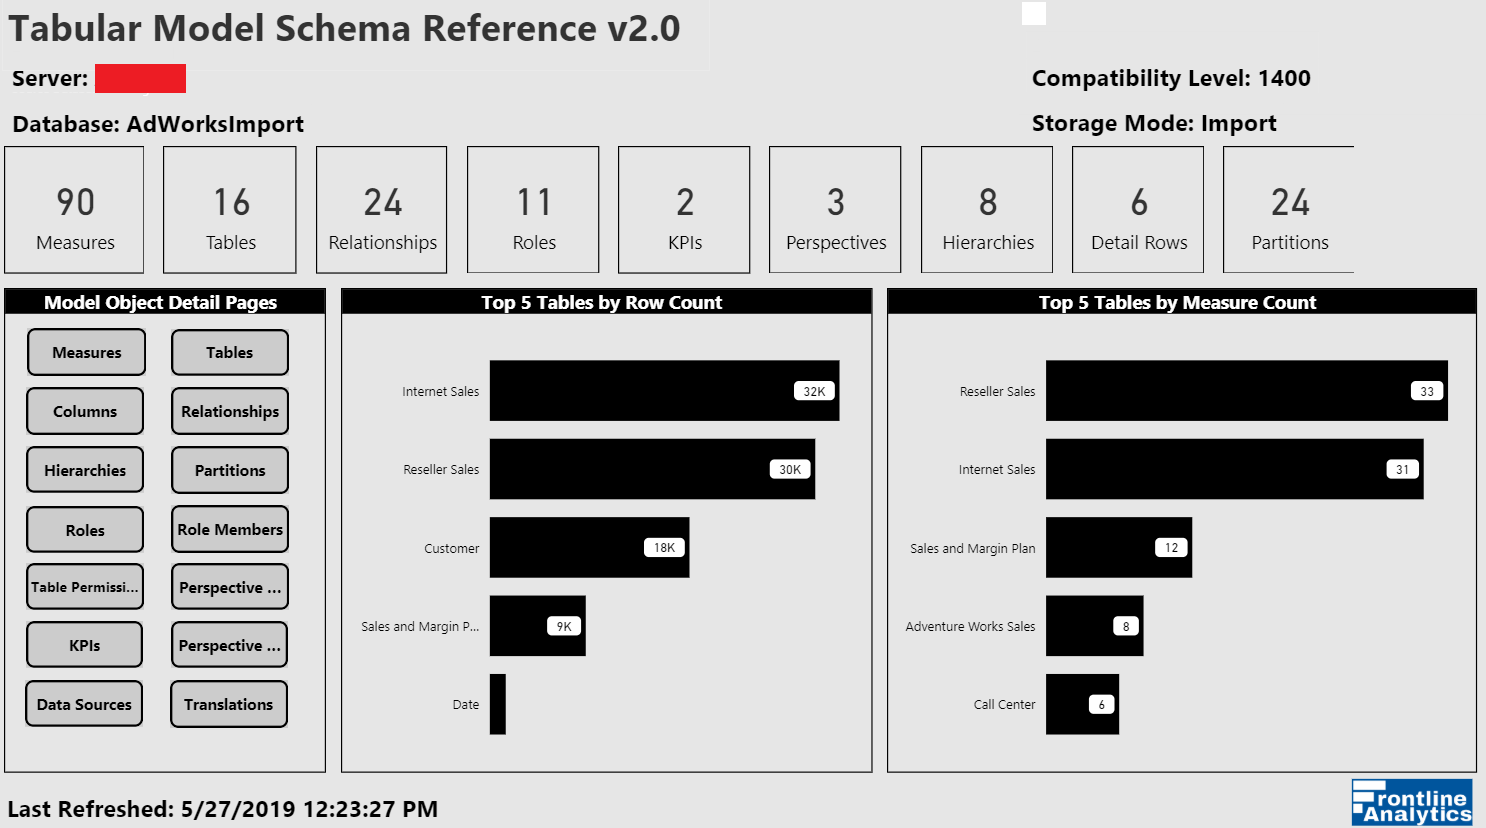
Model Summary: SSAS Tabular 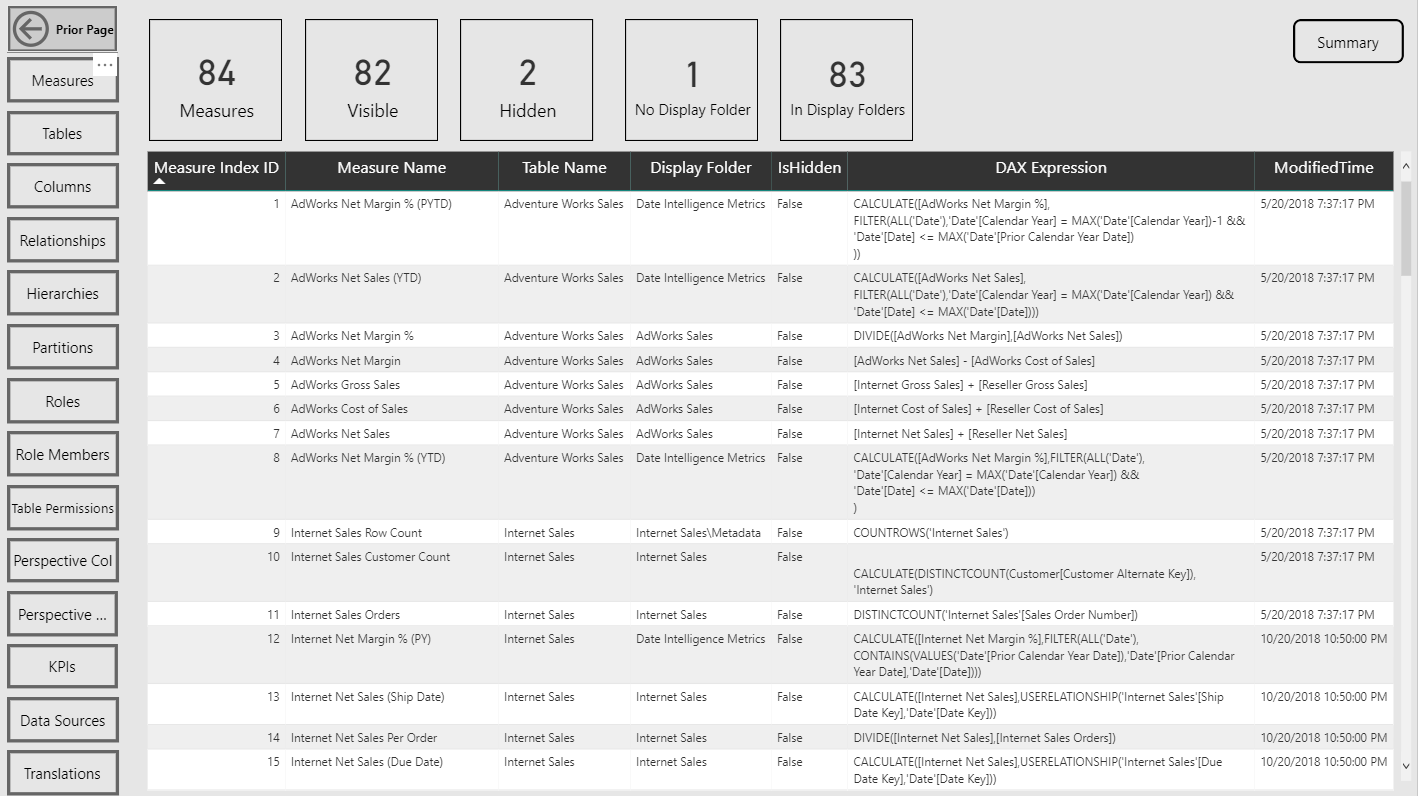
Measures Report Page 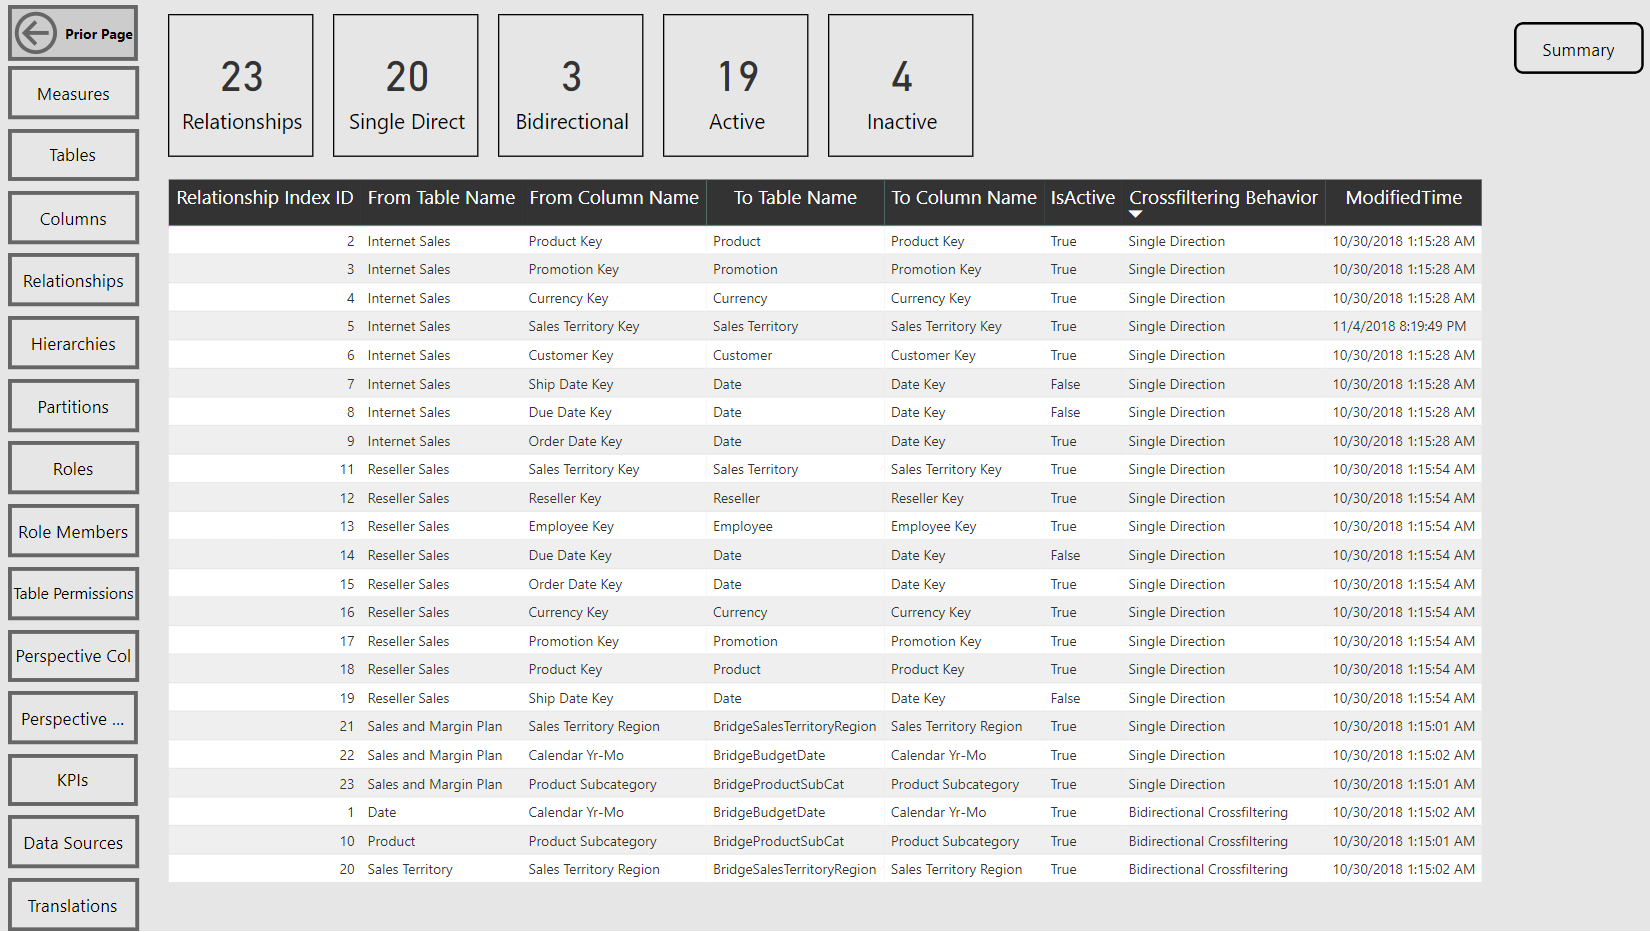
Relationships Report Page 
Columns Report Page 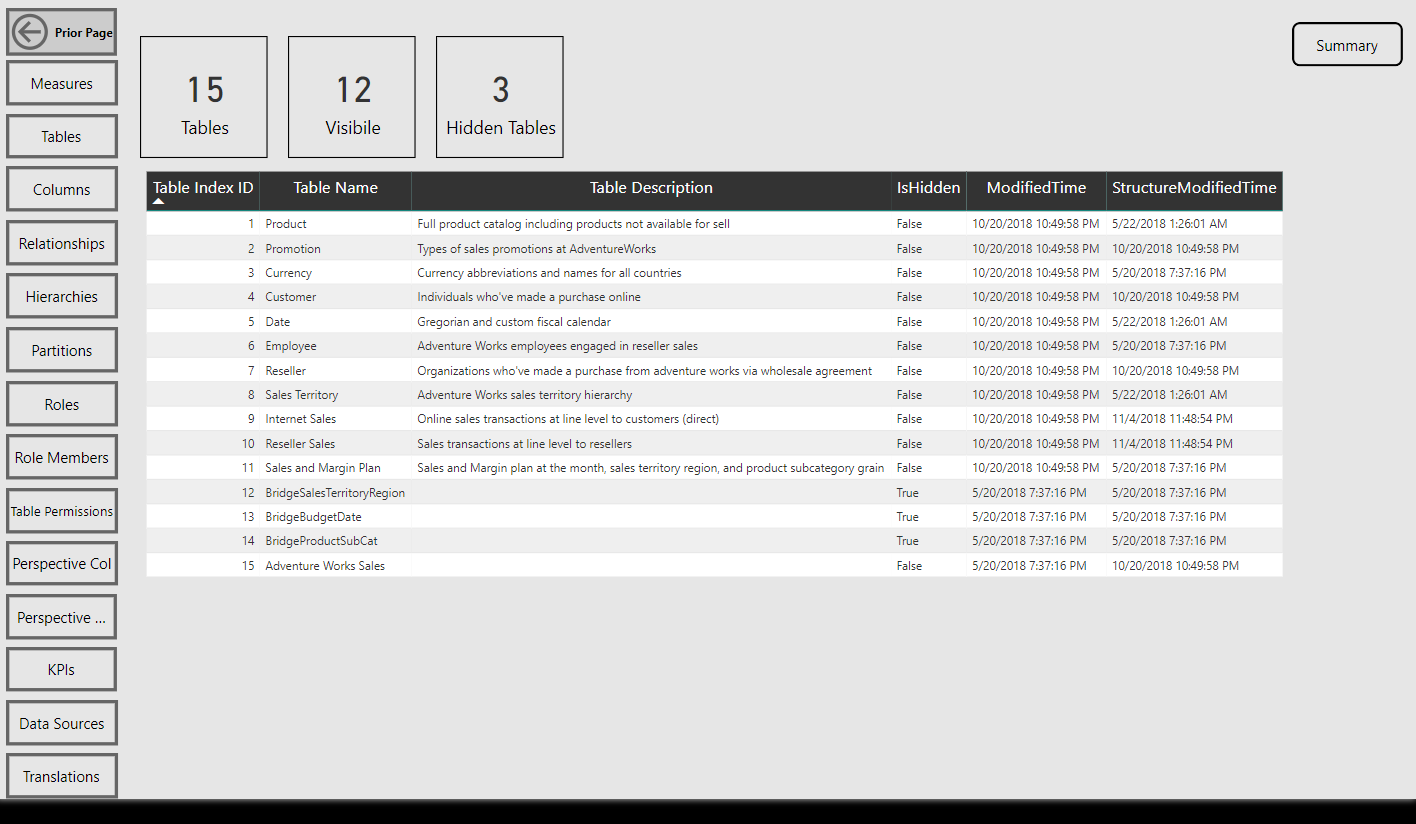
Tables Report Page 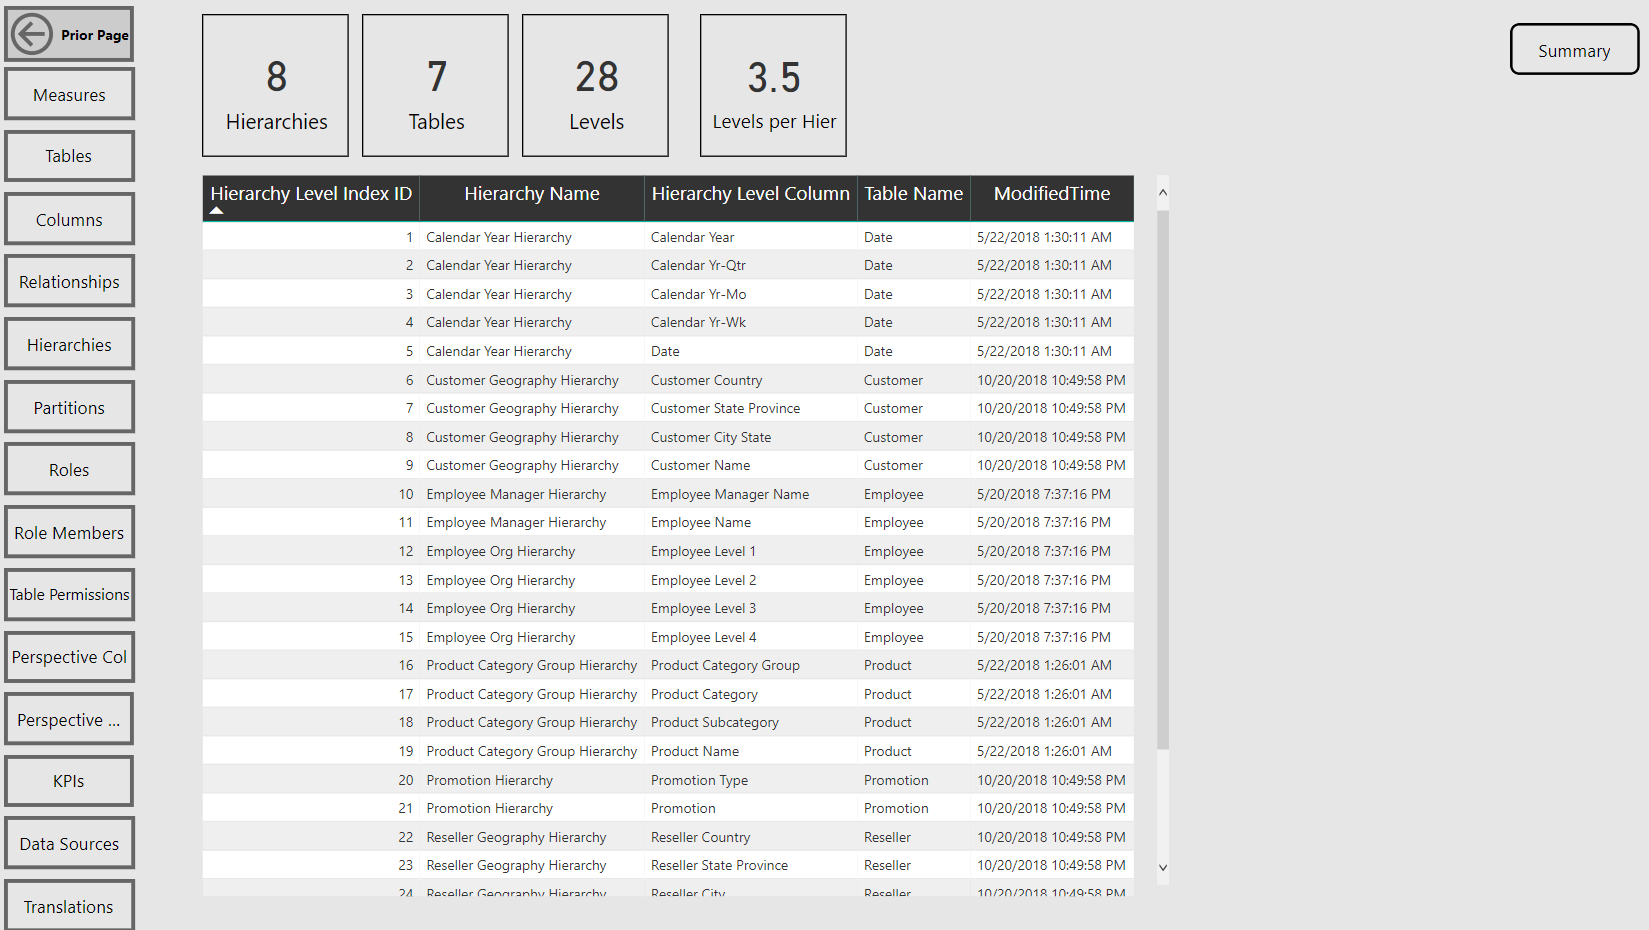
Hierarchy Levels Report Page 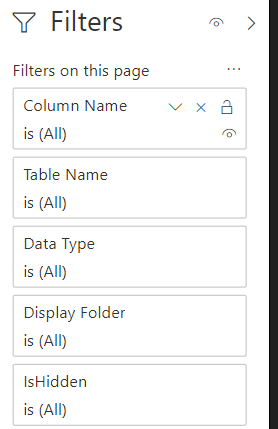
Filter Pane: Columns Report Page 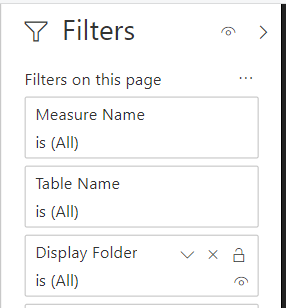
Filter Pane: Measures Report Page 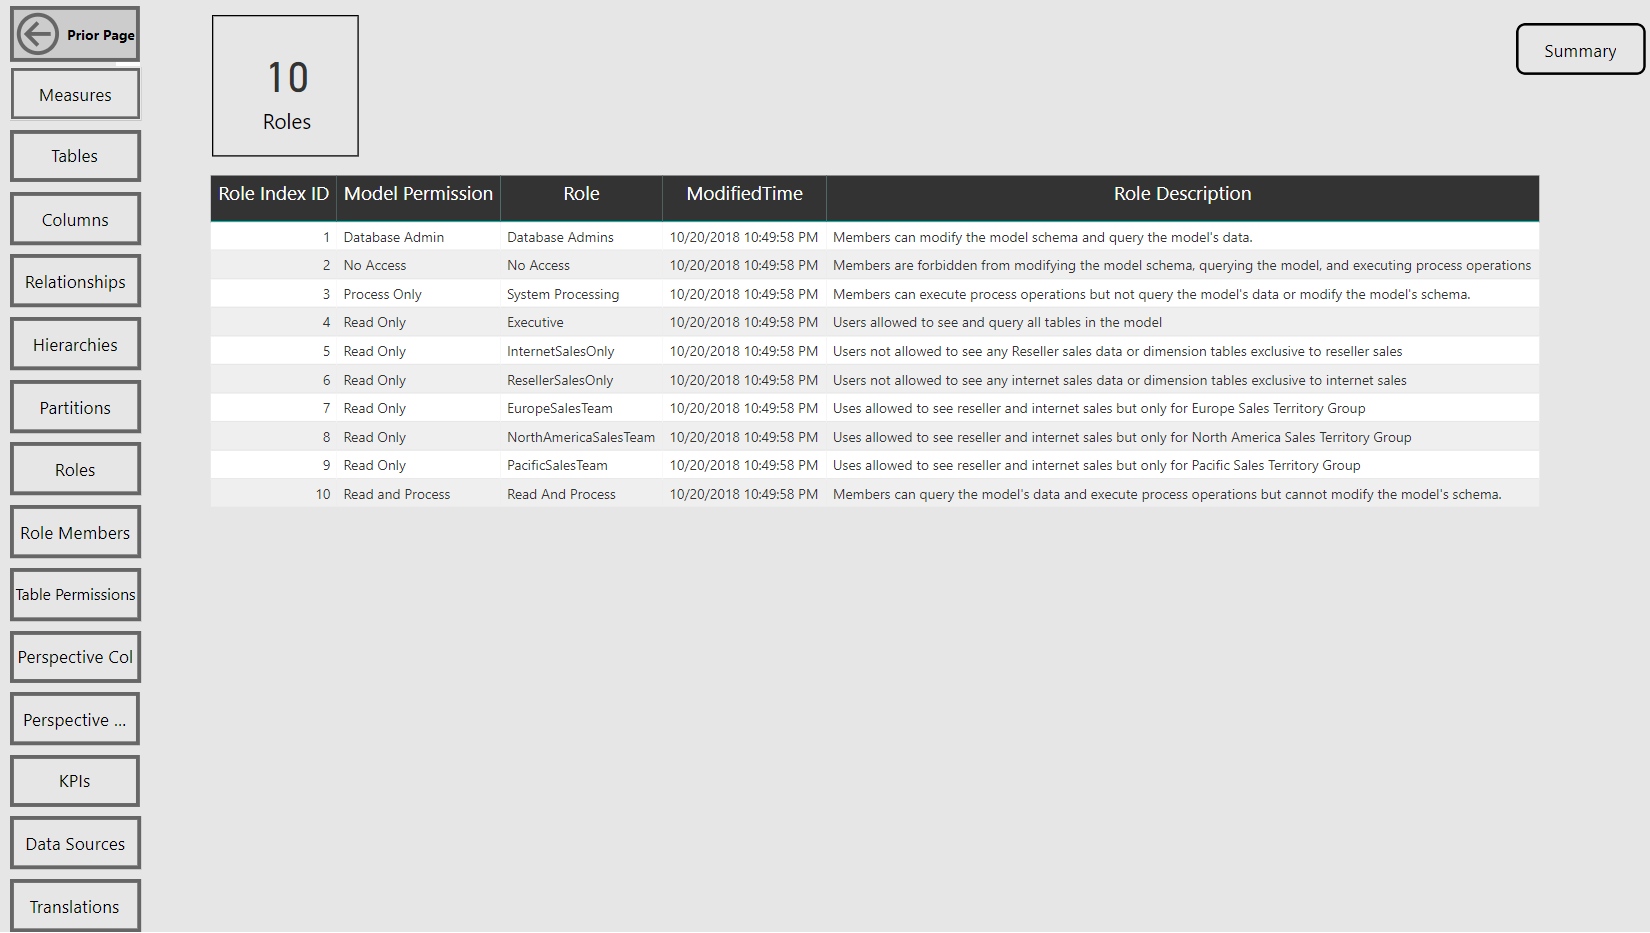
Roles Report Page 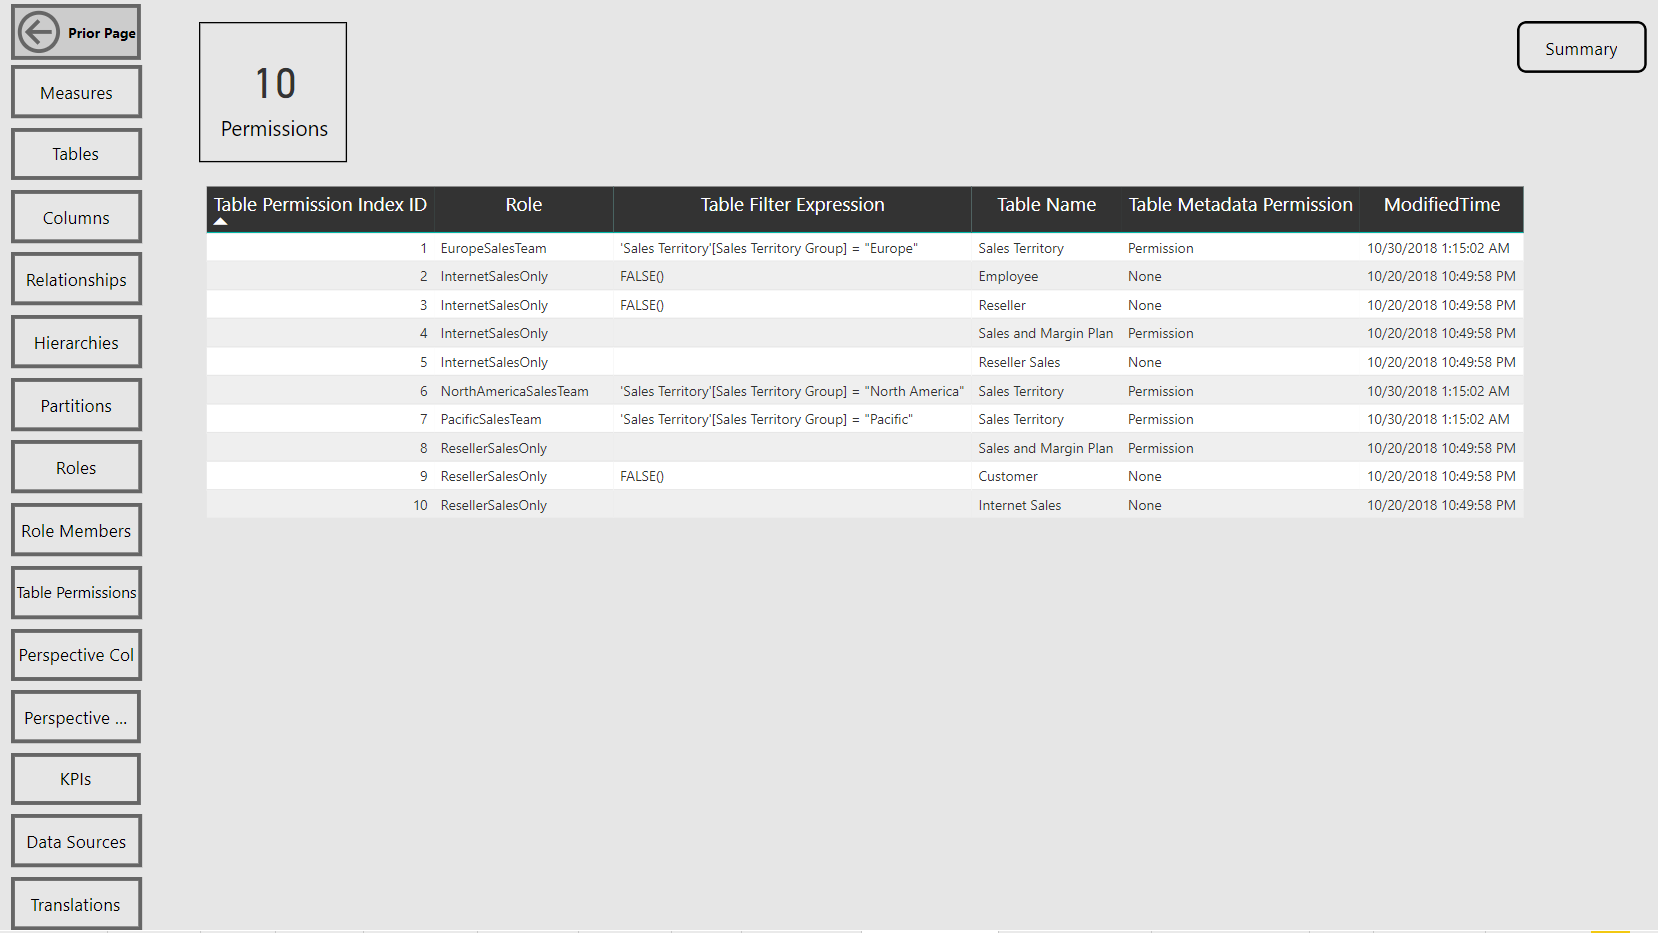
Table Permissions Report Page
Per the sample images from the Model Summary report page, the tool identifies the compatibility level (e.g. 1400 (Analysis Services 2017)) of the data model as well as its storage mode (Import or DirectQuery).
Navigation across the various report pages is handled via buttons linked to bookmarks, a fairly standard design in Power BI reports at this point. The report pages themselves are almost exclusively just table visuals with one row per item of the given database object. Rather than slicers, you can open the filter pane to make common selections such as the measures within a particular display folder.
Be aware that a few of the Analysis Services Tabular model object types such as Perspectives, KPIs, and Detail Row Definitions are currently exclusive to Analysis Services. Thus, if you run the tool against a Power BI dataset you’ll have a zero for these objects. (That being said, there are certainly a few modeling features unique to Power BI datasets and Microsoft has advised that Power BI datasets are to become a ‘superset’ of Analysis Services.)
As primarily a reference tool the rich dashboard visualizations you’d typically see in Power BI reports are not present, at least in this version. However, the simple cards, filter pane, and other elements should make for quite the improvement over the prior Excel-based version.
Use Cases
As its name implies, the tool is intended to deliver easy visibility to the schema and metadata of a Tabular model. For example, if you’re new to a particular model, you can very quickly get a sense for how large and complex the model is by the count of tables, measures, and the count of table rows. If you work with a particular Tabular model (or Power BI dataset) every day, and especially for larger models supporting multiple business areas, you may may find this tool much easier for looking up various details and in troubleshooting scenarios than clicking through the model authoring application (PBI Desktop or SSDT, generally).
Two items that would jump out at me as causes for concern would be the presence of many bidirectional cross-filtering relationships and calculated columns. I’d want to understand the tables involved, their size, and whether this is necessary.
How it Works
Fundamentally, like prior versions, the tool still queries the DMVs, integrates and enhances this data, and loads simple table reports by object type. In this version, I’ve separated out the Power Query M expressions which exclusively access the DMVs from those that enhance or transform this data. I’ve also taken advantage of several Power BI report authoring features including buttons, bookmarks, and the new filter pane per the images from the slideshow.
Since the template becomes a PBIX file which you own, you’re free to open the Power Query editor to review the data retrieval process. You can implement any changes at any layer (Power Query, Model, Visualization) you believe to be appropriate.
Future Enhancements
I don’t plan on any further changes for at least 3-4 months. If I find the need to make a small change, I’ll publish a new template to the GitHub repository. If/when a more significant change is made, I’ll write a blog post describing these enhancements.
Something I’d like to add is the cardinality and/or memory usage per column. For example the user should be able to very quickly find the most expensive columns from a resource and performance standpoint without having to open up a tool dedicated to performance tuning or writing out a DMV query on an ad hoc basis.
I’d also like to add more intelligence to the tool such that it calls out or ‘flags’ potential risks to the given model in dedicated report pages/visuals. Maybe something that rates the overall health or risk of the model could be useful too (e.g. “This model is an ‘A’ and thus is suitable for the production environment while this model is a ‘D’ and likely needs significant re-factoring work”)
Other Documentation Tools
There are certainly other tools and services which can be used to address many of the same model documentation and metadata issues. I’ve experimented with a few of these tools and, at least for me, I see value in having complete ownership and flexibility such as adding a column with logic specific to the model or data I’m working with. On the other hand, I can see many others just wanting to offload all maintenance and being locked into a standard view. It’s your call.
Wrapping Up
I hope you’re able to give this updated Tabular Model Schema Reference a try and that you have a reasonably good experience. If this tool isn’t relevant or helpful for you, maybe you’ll find a future blog useful – I plan to write about automated Power BI deployment scripts and Power BI Admin datasets later this summer. You can click ‘Follow’ in the Subscribe widget to be notified of any future posts.

One comment