The June 2019 release of Power BI Desktop includes conditional formatting support for card visuals. Therefore, it’s no longer necessary to layer table or matrix visuals with card visuals to leverage the conditional formatting that was exclusive to the table and matrix visuals.
Per the following image, you just select the card visual and then open the Background card within the formatting pane:
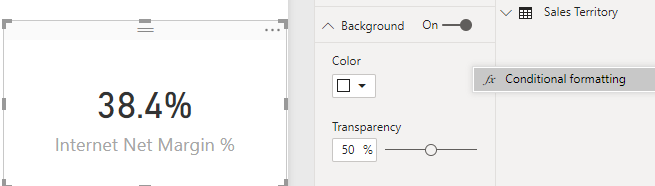
Hover your mouse to the right of the Color dropdown and three dots will appear. Click these dots to expose the Conditional formatting menu item displayed in the above image and finally just click Conditional formatting to launch the conditional formatting dialog.
It’s too bad that we’ve had to resort to workarounds for something as basic as conditionally formatting card visuals, which are often the most important visuals of the report. Nonetheless, a broader takeaway from this example is that Power BI has matured and closed many gaps such that workaround approaches (layering visuals) and reliance on custom visuals is increasingly unnecessary.
Prior to June 2019 Release:
Let’s say you want to add conditional formatting to a card visual in a Power BI report. I often use (and recommend) the standard KPI visual and the Power KPI custom visual as powerful alternatives to standard cards but sometimes you don’t have a target value to compare against and you also may not need to show a trend within the visual.
In this simple scenario, you simply want the background color of the card to reflect one of three possible conditions per the following example:

The standard card visual doesn’t support background conditional formatting so you have to supplement the Card with a visual which does support background conditional formatting, like a table.
Steps to Build
- Identify the measure to be used in the card visual and the conditional rules to implement.
- Add a card visual on the report canvas with the size you’d like to display.
- Add a table visual on the report canvas with the same measure and an attribute which only has one distinct value.
- The purpose of this is to ensure that the background color will stay the same size regardless of any slicer selections and cross-highlighting.
- Conditional formatting isn’t displayed without at least one attribute.
- If you don’t have a column with a single value, you could add this to a SQL query or View object you’re referencing or use the Table.AddColumn() function in M (Power Query).
- (Yes, you could also create a simple column via DAX but as you may know from past blogs/books DAX isn’t the best tool for these tasks and it’s best to avoid DAX columns and tables when the same structures can be easily created in the source or SQL or M.)
- The purpose of this is to ensure that the background color will stay the same size regardless of any slicer selections and cross-highlighting.
- In the table visual, minimize the width of the attribute on the left via the column header such that only the name of the measure is visible.
- In the formatting pane, set the column headers font color to white to match the white background color.
- Also in the formatting pane, set the outline of the column headers to none and turn the Totals off.
- At this point, you should only be seeing one value such as 38.6% (no column headers, totals, outline, etc).
- Apply the three conditional formatting background rules via the dropdown in the Values field well or the Conditional Formatting card in the formatting pane like follows:
-
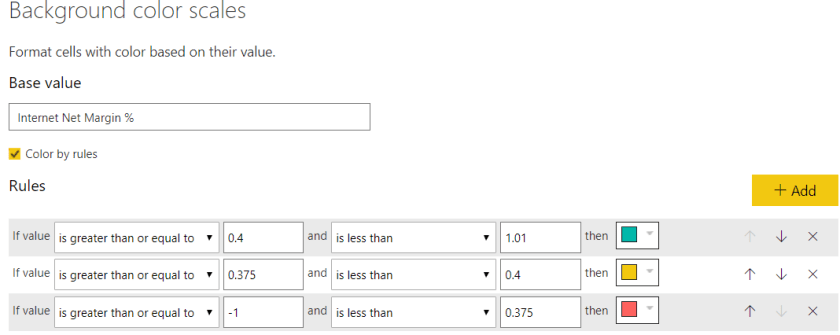
Conditional Formatting Rules
-
- Apply the same three conditional formatting rules to the font color scales such that the background color and the font color always display the same color.
- Click slicers and cross-highlight to confirm that the conditional formatting is working as expected (Green or Yellow or Red; one size only).
- At this point, you only need ensure that the size of the table visual corresponds to the size of the card visual.
- In the formatting pane for the table visual, increase the text size under the Values card to enlarge the color background. You can also modify the font family to something larger such as Arial Black and you can increase the text size of the column headers.
- With the conditionally formatted background table built and sized appropriately, you can position the table behind the Card using the Format tab (bring to front / send to back)
- For larger cards, you may have to make a copy of the background table and stack the two tables precisely on top of each other to provide a large enough background.
Of course, you can’t pin the Card with the background table to a dashboard – the conditional formatting is limited to the report. Also, although a single value in a table usually isn’t very expensive from a performance standpoint, it’s worth keeping an eye on the increasing volume of queries being generated due to background/supporting visuals.
Wrapping Up
This seems to be a common enough scenario that maybe conditional formatting for backgrounds of Cards and other visuals will be developed at some point. Until then, this work-around will have to suffice as it transforms a plain, static card to something with intelligence to potentially drive a useful action or response.
Upcoming Events
- I’ll be presenting the DAX Query Use Cases session I recently delivered at the Data & BI Summit at SQL Saturday New York City on May 19th.
- This is an intermediate session and is packed with realistic examples such as paginated reports on top of Analysis Services (Tabular) and embedding queries (NaturalInnerJoin, Union, etc) within DAX measures.
- I’m also an instructor for Power Up – a Power BI virtual training event.
- Per the event page, my two-hour session is on data modeling.
Given these events and other projects I likely won’t be able to blog again for 3-4+ weeks.

Please…. I beg of you to show us how to do this in a video. Step 3 makes zero sense to me and I need to SEE it created in order to understand. No amount of words written will help me understand what that sentence means in any way.
LikeLike
Thanks for your suggestion. To be transparent I’ve never created a video. It’s something I’ve thought about, such as having a YouTube channel that supplements this blog, maybe with just basic (CamStudio?) tutorials to start with.
Since this post is one of the more popular recent posts and since several others would likely benefit from a supporting video it’s something I’ll look into again but there’s no timeline or guarantee.
LikeLike
I second that request. Am completely stuck on that extended third step. I figured the Conditional formatting would work but even with the rules set, there is no change.
LikeLike
This is high level wizardy! Thank you! It would be even more helpful to have the sample .pbix file if possible, as the styling (not the conditional though) of the table component took me a while to figure it out.
LikeLike