For this week’s blog post I’ve created the following event pizza order calculator:
If it’s not self-evident, you can use the slider bars in the Pizza Order Variables table (e.g. Attendance %) to modify the estimated pizza order. You can also click the buttons under Saved Scenarios to access a pre-built set of variable values.
The calculator leverages Power BI’s What If parameters, bookmarks, buttons, conditional formatting, and a few simple DAX expressions to deliver interactive scenario building.
The main purpose of the calculator is to simplify the pizza order process for Microsoft BI user group organizers and volunteers, such as at Boston BI. The calculation logic, variable selection controls, and web interface eliminates the need for ad hoc calculations and the dependency on the user’s device and other tools (e.g. Excel, SQL). The calculator may also benefit the accuracy of event orders and thus contribute to the more efficient use of group funds.
The following sections provide context and walk through the essential components.
Note: Like many blog post examples, production-ready formatting and visualization aesthetics is not the goal or priority of this post. As just one example, there typically wouldn’t be white space in the top and bottom right sides of the report page.
Current State: Ad Hoc SQL Queries
One of the responsibilities of user group organizers, in addition to securing event sponsors and speakers, is to order food for each event based on the expected turnout and other variables such as available sponsor funds and available discounts. Like many other organizers, in the past I’ve used a very simple Excel worksheet (no DAX, Power Query, or data model) to estimate event food orders. Recently, a local SQL Server group organizer shared the following SQL query he uses to place pizza orders:
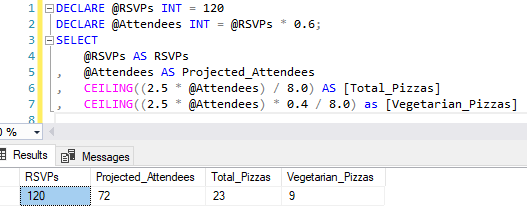
Per the above image, the query takes the RSVP count and estimates that 60% of these RSVPs will actually attend the event. Of these attendees, it’s assumed that 2.5 slices of pizza will be consumed per person and that 40% of the pizza required should be vegetarian. (In this model, a ‘pizza’ is defined as a large pizza with 8 slices)
In the future, group members who consistently RSVP for events but don’t attend may be denied registration (automatically).
Current State Limitations
Let’s briefly document a few issues and limitations with this approach:
- The user needs access to a SQL Server database engine instance on their PC to run the query.
- Values for all variables must be entered by hand.
- Differences generated by alternative inputs is not easily determined.
- Not all variables are clearly defined (e.g. Slices Per Attendee = 2.5).
- Other useful variables and calculations are not included such as available group funds and the cost of the pizza to order.
The same issues are also present in the Excel formula-based approach.
Project Objectives
The Power BI-based approach should address the documented limitations with the current state via the following:
- A web interface with all variables and calculations (metrics) clearly exposed.
- A slider input for each variable enabling click-and-drag user interactions.
- Additional variables and calculations including order cost and sponsor funds.
- Multiple scenarios should be persisted (stored) within the solution enabling the user to quickly access common scenarios rather than build from scratch.
Step 1: Define the variables (inputs)
The following six variables are required to drive each defined scenario:
- Count of RSVPs
- % Attendance
- Event Sponsor Funds
- Slices Per Attendee
- % Vegetarian
- Cost per Pizza
Therefore, a What If parameter is needed in the Power BI Desktop file (.PBIX) for each of these variables. The following four images highlight the essential steps of creating What If parameters in Power BI Desktop:
You can also review official What If parameter documentation for more details.
Naturally more variables would give the calculator more granular precision such as the sales tax rate to apply and distinct slices per attendee variables for vegetarians and non-vegetarians. In this report, we’re using the 7% sales tax currently in place for Boston (Massachusetts).
Step 2: Write the DAX measures (outputs)
The What-if parameters provide their own DAX measure tied to the selected/filtered value of the parameter column such as the following:
Event Sponsor Funds Value =
SELECTEDVALUE('Event Sponsor Funds'[Event Sponsor Funds], 250)
In this case, if more than one value is in the filter context of the Event Sponsor Funds column of the Event Sponsor Funds table (created via the What-if Parameter), then the value 250 is returned.
Therefore, new DAX measures can be written which reference these parameter-based measures such as the following:
Estimated Attendees = [Attendance % Value] * [RSVPs Value]

Vegetarian Pizzas =
VAR SlicesPerPizza = 8
VAR VegEventSlices =
[Estimated Attendees] * [Slices Per Attendee Value] * [Vegetarian % Value]
RETURN
ROUNDUP(DIVIDE(VegEventSlices,SlicesPerPizza),0)

Non-Veg Pizzas =
VAR SlicesPerPizza = 8
VAR NonVegEventSlices =
[Estimated Attendees] * [Slices Per Attendee Value] * (1-[Vegetarian % Value])
RETURN
ROUNDUP(DIVIDE(NonVegEventSlices,SlicesPerPizza),0)

Estimated Total Pizzas = [Non-Veg Pizzas] + [Vegetarian Pizzas]

Pizza Cost =
VAR TaxRate = .07
VAR FoodCost = [Estimated Total Pizzas] * [Cost Per Pizza Value]
RETURN
FoodCost * (1+TaxRate)

Sponsorship Surplus/Deficit = [Event Sponsor Funds Value] - [Pizza Cost]
With the variables (inputs) and measures (outputs) created, the focus can turn to the formatting and visualization aspects.
Step #3: Format the Report Page
Like most reports, the most important metrics or KPIs are placed in the top-left section of the page below a page title. This positioning allows the user to quickly and intuitively answer their most important questions (“How many pizzas to order?” “What’s the cost?”).
Slicers based on the What-if parameter columns are formatted with the ‘Single Value’ slider input option per the image in Step #1. This formatting option is not available to normal numeric columns you create or import outside of the What If parameter experience.
You may think that the ‘What If’ graphical user interface isn’t technically necessary as you could just create your own single-column table via the GENERATESERIES() DAX function. However, for the best what-if analysis user experience (Single Value slicer), it actually is necessary). Additionally, note that once you choose ‘Single Value’ for the slicer, you won’t be able to revert back to other slicer formats such as List, Dropdown, Between, etc.
The variable slicers contrast their white values with black background and shapes (rectangle, lines) are used to help group the variables together.
It’s not essential for this report but I used a table visual with rule-based conditional formatting as the background to the Surplus/Deficit card. This technique, described in this blog, visually indicates (Red) when the cost of the pizza order exceeds available sponsorship funds (Green otherwise). Unfortunately a less involved method of applying conditional formatting to standard Card visuals doesn’t appear to be coming soon.
Step #4: Bookmarks and Buttons
Per the objectives we want to store certain common scenarios (sets of variable values) to reduce the interaction required from the user. For example, if the user commonly has $250 of sponsor funds available and 100 RSVPs then at least these values should be built into one or multiple pre-defined scenarios.
Bookmarks and buttons (which can be linked to bookmarks) are made to handle this requirement. In this case, I’ve adjusted the variable values and saved bookmarks (View – Bookmarks Pane) associated with three different scenarios (Base, Low Attendance, High Attendance). Each button (Insert – Buttons) is then associated with a bookmark in the Action formatting card. Specifically, a Blank button type is used, text is entered for each button, and the ‘on hover’ state of the button text is formatted.
Finally, a Scenarios table was created via Enter Data (Home tab – Enter Data) to advise the user of the different variable values associated with each scenario.
Step #5: Validation Testing
Why 23 pizzas in the base scenario (7 Veg, 16 Non Veg) at a cost of $209.19?
Veg pizzas = 7
100 RSVPs * .7 attendance rate * 2.5 slices per attendee * .3 vegetarian
(6.56 rounded up to 7)

Non-veg pizzas = 16
100 * .7 * 2.5 * .7
(15.3 rounded up to 16)

Cost = $209.19
(23 pizzas * $8.5 cost per pizza = $195.5 food cost) +
(.07 * $195.5 = $13.69 sales tax)
Per the card visual, the base scenario provides $40.82 in surplus funds beyond the event sponsorship.
Wrapping Up; A New High in Book Sales
As is so often the case in Power BI (and BI projects broadly), it’s the integration of diverse features into a single, cohesive solution that produces the most value. Understanding where synergies exist within the platform (query/transform, model & dax, visualization) is more relevant and valuable in many scenarios than a deep expertise in any one particular tool or skill.
I only have visibility to weekly book sales for the United States but, in the United States at least, last week was my highest selling week to date. Obviously there are several other Power BI learning/training resources available so for readers of both this blog and my books I just wanted to mention that I appreciate your decision and I hope you find good value in either title.
If blog posts like this and others on Insight Quest are useful you can click ‘Follow’ to get notified of future posts.
