A new feature for monitoring the On-premises data gateway was made available for public preview in last week’s release of the May 2019 update. Per the blog post announcement, this feature is intended to replace the Windows Performance Monitor approach for monitoring gateways I described in the Monitoring On-Premises Data Gateways paper back in August of 2016.
Since I’ve been close to this topic for years and since I assume few gateway and/or Power BI admins, who are often the same person or team, have had a chance to evaluate the new (preview) feature I thought I’d share my initial impressions.
Note: The Guidance for Deploying a data gateway for Power BI article on MS Docs currently links to the above-mentioned paper though I assume updated instructions on using the new monitoring feature will be published soon or once the feature is moved from Public Preview to general availability (GA).
Why This Matters: The Details
You can now analyze gateway query activity by data source type (e.g. SQL, ODBC, Folder, etc), data source (e.g. a specific SQL Server Database), and Query Type (Refresh, DirectQuery). Therefore, in troubleshooting scenarios or just general analysis, a gateway administrator can quickly isolate issues to a particular data source or conclude that the problem is impacting all gateway data sources.
If gateway query performance and reliability issues are present across all gateway data sources, this may imply the need to scale up the gateway server, add another gateway to the cluster, or migrate existing workloads to cloud sources which don’t require an on-premises data gateway.
Gateway and Power BI service admins may be surprised by which data sources are being utilized the most, the query performance of each source, and they can now easily monitor the growing or declining utilization of data sources their gateways support. Although BI teams seek to consolidate data sources to a single data warehouse system or ‘version of truth’, the very common reality is that several data sources are configured for gateways and, often further complicating matters, Power BI datasets and dataflows may merge these sources together.
As just one example of a new use case this feature enables, the admin team may think (or hope) that a legacy Oracle database is rarely used for reporting at this point given past data warehouse migration projects and that a Teradata database now supports the lion’s share of queries coming from Power BI. Analysis of the gateway query execution logs may reveal that a significant dependency on the legacy Oracle database still exists and also provide useful insights on the performance differences between the two sources.
Each row of the Query Execution Report log file represents an individual query handled by the gateway. In addition to the date and time the given query was executed, whether it succeeded or failed, and its duration, you also know whether the query was supporting a refresh process (QueryType) and its data source.
Several of the most useful columns from the Query Execution Report are included in the following image:
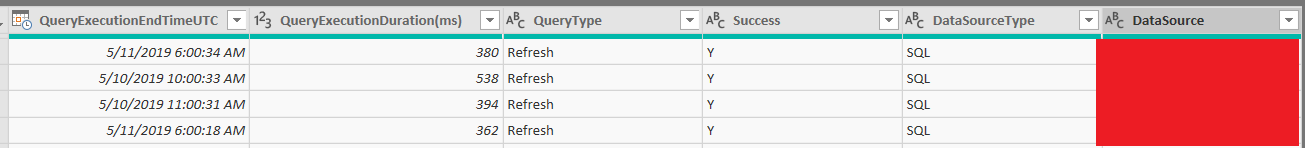
With the six columns of the above image alone and the granularity at the individual query level, a gateway admin could derive a number of insights about gateway utilization and potentially the overall Power BI deployment, particularly if the gateway data sources reflect the main data sources of the organization.
In addition to the columns included in the above image is an ErrorMessage column which can help point gateway admins towards the kinds of errors (if any) occurring and the relative frequency of each error type:
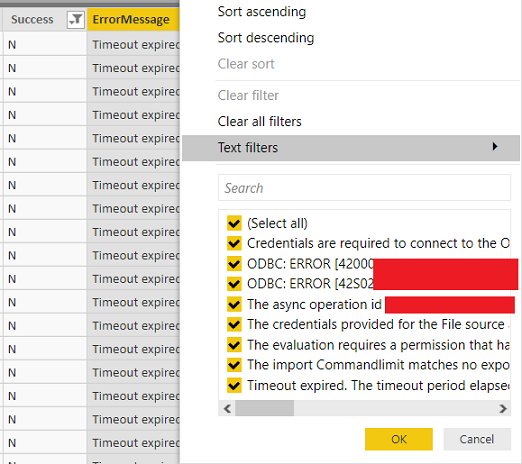
In the above example, the errormessage column provides the message “Timeout expired. The timeout period elapsed prior to the completion of the evaluation.” An experienced Power BI admin may know the default command timeout duration for the given data source such as 10 minutes for ODBC and SQL Server data sources and thus interpret this message as a performance/capacity issue with the data source.
However, Power BI users can specify higher command timeout durations within the Power BI datasets and dataflows they own and it’s entirely possible that the query itself is very inefficient so further investigation could be needed.
The main point is just that gateway admins can quickly identify the most common error messages for queries (optionally by source) that failed (Success = ‘N’) thus expediting the troubleshooting process.
Aggregation Log Files
I assume that the Query Execution Report log file will be the most valuable to gateway admins given its detail/grain. However, the two aggregate files – Query Execution Aggregation Report and System Counter Aggregation Report will also have their use cases.
The System Counter Aggregation Report includes the following six counters:
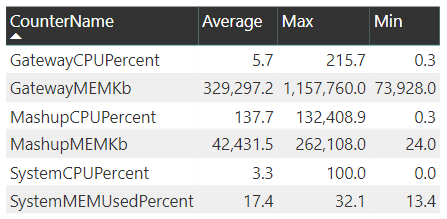
As mentioned earlier, the documentation for this new feature has not been published yet so the definitions and proper interpretations of each counter is not yet publicly available. However, clearly the 3 CPU and 3 memory counters should help distinguish how gateway resources are being used such as data transformations in Power Query (M) expressions that aren’t folded to the data source (Mashup engine) or maybe other processes beyond the gateway service are consuming resources on the gateway server (System).
The two facts of both query log files are Data Processing Duration and Query Execution Duration (both in milliseconds). The aggregation log file (Query Execution Aggregation Report) includes average, max, and min columns representing aggregations of these facts. In the case of the Query Execution Report file, you could write a few DAX measures to implement these simple calculations against the source columns.
The following table visualization based on columns from the Query Execution Report file exposes the data processing duration and query execution duration of five successful queries:
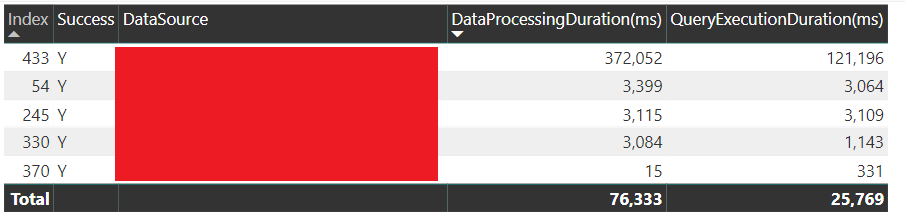
The Index column is added in the default M expression that comes with the new template (.PBIT) file downloadable from the announcement blog. The RequestID and QueryTrackingID columns are also included in the Query Execution Report log file and, though likely not used often in monitoring reports, could be needed in troubleshooting specific issues.
Current Limitations
I’m excited about this new monitoring feature and I look forward to moving away from the current custom gateway monitoring approach with Windows Performance Monitor. I’m also confident that current and future projects/customers will benefit from the new monitoring details available.
However, I also wanted to call out several (8 actually) limitations I’ve found in reviewing this initial release:
- The actual queries such as T-SQL statements sent to SQL Server and DAX queries sent to SQL Server Analysis Services are not included.
- Therefore, you can’t pinpoint which data source objects (tables/views) are being queried and/or returning poor performance.
- The Power BI dataset which submitted the query is not included.
- Therefore, you can’t associate slow or unreliable queries to particular datasets and thus contact the owners of these datasets.
- Likewise, the app workspace containing the source dataset of the query is not included the log files so you can’t contact the workspace members or admins.
- The date/time columns such as Query Execution End Time are in UTC.
- Therefore, you’ll need to apply some custom Power Query (M) logic to add date/time columns that reflect when the queries actually occurred for your tenant (e.g Monday at 7 AM).
- This isn’t that complex if you’re at all experienced with Power Query but many IT/BI admins aren’t.
- Therefore, you’ll need to apply some custom Power Query (M) logic to add date/time columns that reflect when the queries actually occurred for your tenant (e.g Monday at 7 AM).
- The template does not use DAX measures.
- All the visuals rely on default summarization and implicit measures – one of the data model anti-patterns I wrote about previously.
- You’ll want to add DAX measures with explicit aggregation expressions and hide the source columns for these measures.
- The template uses custom visuals.
- The Small Multiples Line Chart is used on the Execution by data source and Execution by Query type report pages.
- Your organization may have a policy or tenant setting which blocks the use of custom visuals.
- In a future blog post I may explain my perspective that you should always try to avoid custom visuals, particularly for any production environment.
- The template doesn’t include a date dimension table.
- The template relies on its UTC date/time columns for the out-of-the box visuals.
- The lack of a date table is also a data model anti-pattern so you’ll want to either A) create a new query in the monitoring dataset to retrieve an existing date table from a database or B) create an expression within the Power BI file which computes the date table for you.
- This only produces log files for one gateway server.
- If you need to monitor two gateway servers which comprise a gateway cluster, you’ll have to enable the logging for both servers and then develop some custom integration process (via SSIS or ADF to consolidate the log files).
- The out-of-the-box visuals and overall user experience is very basic with minimal formatting and limited interactivity.
- You’ll almost certainly want to significantly enhance or replace the report pages that come with the template to make the visuals more insightful and easier to use.
- For example you may replace the slicers with the filtering pane to save space and you may add a few bookmarks and buttons to make it easier to navigate different views of the report.
Custom Template Coming?
In a future blog post I may share a template (.pbit) which I believe helps address several of the limitations mentioned above with the initial preview template. The Power BI gateway team mentioned in the blog announcement that they will be iterating on the template so maybe this won’t be necessary or maybe someone else in the Microsoft BI community will publish/blog an enhanced alternative. Additionally, I’d like to review forthcoming documentation on the meaning of each counter before I develop any of my own monitoring solutions on top of these log files.
Beyond these reasons, there are a couple other technical blog posts regarding Power BI admin datasets and automated deployment scripts that I think will be more valuable to readers.
Wrapping Up
Thanks for stopping by Insight Quest and as always feel welcome to leave a comment with any idea, suggestion, or issue you have. Also, to receive email notification of future blog posts, you can click ‘Follow’ in the Subscribe widget.

2 comments