In addition to the TMSCHEMA DMVs utilized by the Tabular Model Schema Reference v1.1, several of the ‘DISCOVER’ DMVs such as DISCOVER_CONNECTIONS can be useful in monitoring Analysis Services. Although monitoring Analysis Services generally involves other tools such as Extended Events, SQL Server Profiler, and performance monitor counters or Metrics for Azure Analysis Services, a simple Excel-based tool which exposes the details of these monitoring-related DMVs may also have its use cases.
Analysis Services Monitoring Report v.10
The following report, available for download on GitHub, utilizes Power Query for Excel to retrieve the schema rowsets for six Analysis Services DMVs into Excel tables:
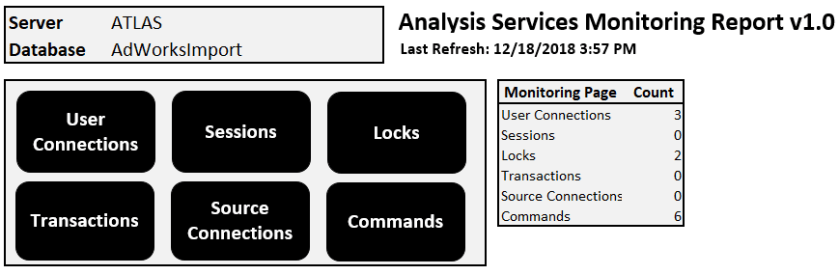
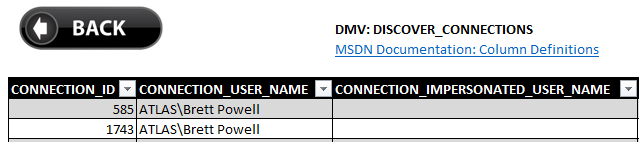
Very similar to the Tabular Model Schema Reference, a main menu page provides access to each DMV rowset and advises of the server and database being monitored as well as when the report was last refreshed. Additionally, each report page includes a link to the MSDN documentation describing the columns for the given DMV:
In this initial (v1.0) version, the data retrieval process simply selects all the columns and rows (select *) from each DMV and does not add any additional logic. In a future version, DMV columns such as lock_status and lock_type may be extended to display more intuitive text descriptions thus avoiding the need to reference the column definition links.
Using the Report
After you’ve downloaded the Excel file, you only need to switch the Server and Database parameter values in the Power Query Editor window to the model you want to execute this report against. In the example below, you’d replace ATLAS and AdWorksImport with your server and database, respectively:

You can access the Power Query Editor by exposing the Queries & Connections pane under the Data tab and then right-click one of the queries and selecting edit from the right-click menu. Alternatively, you can launch the Power Query Editor from the Get Data dropdown:

As you’d expect, these DMVs and thus this report can also be used against Azure Analysis Services. In this case, after replacing the parameter values for an active (not paused) Azure AS server, you’ll need to sign in with your Azure AD identity to execute the queries.
A few more notes
- The Home page is protected just to prevent users from typing into the server and database cells.
- These cells contain formulas which will update upon refresh.
- You can unprotect the worksheet to apply your own edits via the Unprotect Sheet icon on the Review tab.
- In my testing the source connections page, which uses the DISCOVER_DB_CONNECTIONS DMV, will sometimes fail to refresh if the Tabular database is refreshing a table or partition.
Wrapping Up
Please feel welcome to share any feedback (positive or negative) you have on this v1.0 monitoring report. It’s definitely ‘bare bones’ but sometimes easy access to several DMVs in the same Excel file can help save time associated with manually writing individual DMV queries in SSMS or another tool. Additionally, with the data loaded to Excel tables, you could consider saving and storing report files periodically thus maintaining a history of snapshots.
I expect to have a new blog post related to monitoring Analysis Services via Extended Events (for both query and processing workloads) out soon.
