In this week’s episode of Insight Quest, Anna, the team BI manager, has assigned two work items to Brett, the BI developer, as part of the current sprint. The first task is to develop and test a row-level security role in a Power BI dataset which restricts role member visibility to the data associated with the user’s direct reports and the direct reports of the user’s subordinates. The second task is to develop and test a DAX measure which calculates the latest value in a fact table for the specific dimension member (e.g an employee) in the filter context. If, however, multiple dimension members are in the filter context, the measure should compute the average of the latest values for these members.
Work Items and Tasks
The descriptions of the two work items and their associated tasks are noted in Azure DevOps (formerly Visual Studio Team Services (VSTS)) per the following three images:
Athletic Performance Dataset
For this project, the dataset is comprised of four fact tables (Player Athleticism, Player Body Composition, Player Strength, and Player Plans) and three dimension tables – Date, Coaches, and Players. Each fact table contains weekly snapshots of player (athlete) performance conditioning data such as body fat percentages and forty yard dash times. Each fact table row is unique to a specific player and date. Additionally, each player is associated with one position coach and the team’s coaches follow a three-level hierarchy from position coach to coordinator to head coach.
All relationships are defined as standard one-to-many single direction cross filtering relationship per Relationships view in Power BI Desktop:
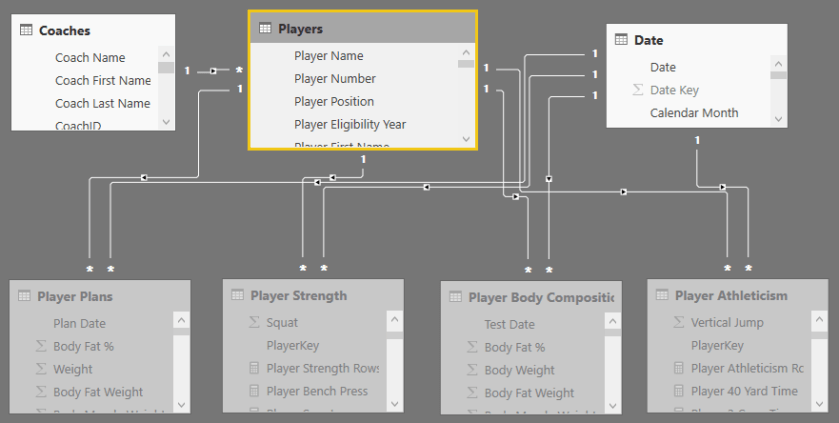
Given these relationships, a filter on the coaches dimension will filter the Players dimension as well as all four fact tables. Therefore, if the row-level security role filters the Coaches dimension based on the logged in identity of the coach, the only table not filtered would be the Dates table which of course is not sensitive data.
Row-level Security (RLS) Step 1: PATH Column
The PATH() function is used to create a DAX calculated column mapping the position of each coach within the coaching organizational structure:
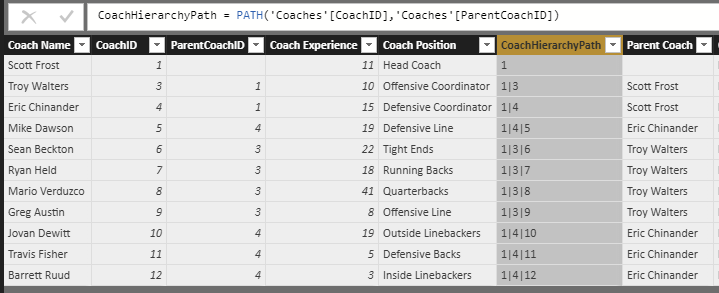
As one example from the above image, Mario Verduzco (Coach ID 8) is the Quarterbacks Coach (this is an offensive position if you’re not familiar with American football) and he reports to Troy Walters (Coach ID 3), the Offensive Coordinator, who in turn reports to Scott Frost (Coach ID 1), the head coach. Importantly, the PATH function only returns the IDs for the given coach – whether that’s two parent coaches (levels of management) or just one or none at all.
The Parent Coach column is not part of the row-level security work item but as an FYI here is the column expression which leverages the PATHLENGTH() and PATHITEM() Parent-Child DAX functions :
Parent Coach =
VAR CoachPath = PATH('Coaches'[CoachID],'Coaches'[ParentCoachID])
VAR PLength = PATHLENGTH(CoachPath)
RETURN
LOOKUPVALUE('Coaches'[Coach Name],'Coaches'[CoachID],
SWITCH(PLength,
    1,BLANK(),
    2,PATHITEM(CoachPath,1,1),
    3,PATHITEM(CoachPath,2,1),
    BLANK()
))
Row-level Security (Step 2): Role Definition
With the parent-child column added to the Coaches dimension in Step 1, the security role can be defined within the Manage roles dialog:
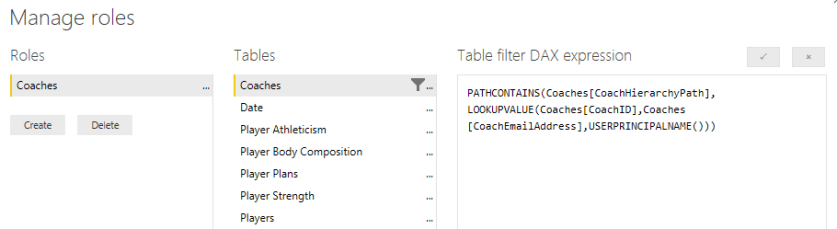
The Manage roles dialog, accessible from the Modeling tab in Power BI Desktop, displays which tables have filter expressions for the given security role. In this example, the new security role (‘Coaches’) has been created and, as mentioned earlier, only the Coaches dimension is filtered given the one-to-many relationship to the Players dimension and the one-to-many relationships between the Players dimension and the four fact tables.
The DAX filtering expression first identifies the Coach ID for the given logged in coach based on the comparison of his UPN (User Principal Name) to the CoachEmailAddress column in the Coaches table. The UPN is the identity of the user when logged into Power BI. The Coach ID value retrieved via LOOKUPVALUE() is then passed as the second parameter to the PATHCONTAINS() function which ultimately filters down the table and thus the related tables.
There are other methods available for retrieving the Coach ID (User ID) value (beyond LOOKUPVALUE) such as with the FILTER() function as the table parameter to a MAXX(). With larger tables to be filtered or more complex filtering logic the performance of the filtering expression becomes much more important. In this example, the simplicity of just two functions (PATHCONTAINS and LOOKUPVALUE) rather than 3 or more was the design decision.
Row-level Security (Step 3): Test
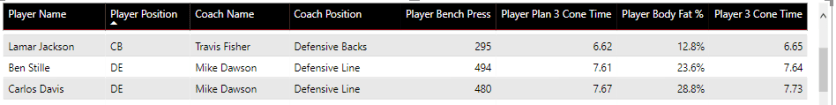
Finally, to test the security role from Step 2, a table visual containing columns or measures from each of the tables to be impacted by the security filter is created on a blank report page like the following:
Before testing, make sure no other filters are applied to the visual via report level or page level filters.
You’ll then use the View As Roles dialog (next to Manage Roles) to select the role created (Coaches) and enter the UPN (identity of user logged into Power BI) to impersonate in the Other user input box:
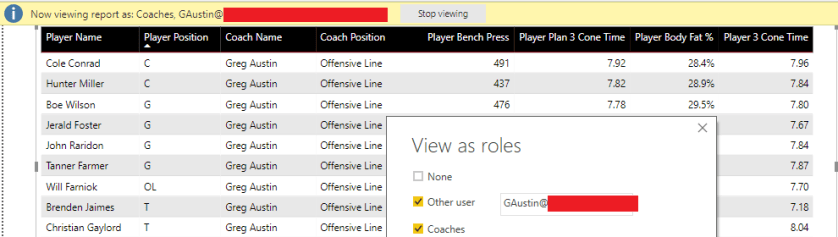
In the above example, Greg Austin, the offensive line coach, is impersonated as part of the test of the Coaches role. As expected, the only data visible in this context (the user Greg Austin) are the offensive line players which Greg coaches. No other player data is available.
Use the View as Roles dialog to impersonate different users representing distinct levels of the hierarchy such as the head coach and the offensive and defensive coordinators.
Semi-Additive Measure
The fact tables are again at the weekly granularity and represent snapshots or points-in-time similar to financial account balances or inventory fact tables. Therefore, you can’t sum the values across time as you would with a typical transaction-based fact table.
Per the requirements, the DAX expression should capture the last available (latest) value for the given player in the current filter context. When two or more players are in the filter context, the expression should take the average of the latest values for each of these players.
For this example, the required DAX logic is built into a measure against the bench press fact. The following matrix visual uses this new measure (Player Bench Press) and is filtered to just two players for testing purposes:
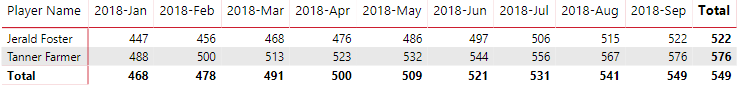
A T-SQL query against the source database can be used to validate/tie to the values such as 522 and 576 for September (as of today) for Jerald and Tanner, respectively:
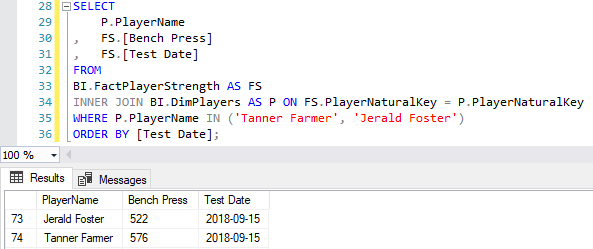
The T-SQL query also reveals the dates associated with other months in the filter context. For example, the 515 and 567 bench press values for August are the last bench press values recorded for Jerald and Tanner in August, respectively. Moreover, notice that the subtotals are reflecting the average of the two players for the given month – this is the intended behavior.
Here’s the DAX measure:
Player Bench Press =
VAR LatestPlayerBench = CALCULATE(MAX('Player Strength'[Bench Press]),
    LASTNONBLANK('Date'[Date],CALCULATE(MAX('Player Strength'[Bench Press]))))
RETURN
IF(HASONEVALUE('Players'[Player Natural Key]),LatestPlayerBench,
        AVERAGEX(VALUES(Players[Player Natural Key]),
            CALCULATE(MAX('Player Strength'[Bench Press]),
                  LASTNONBLANK('Date'[Date],CALCULATE(MAX('Player Strength'[Bench Press]))))))
The key function driving the semi-additive measure is LASTNONBLANK(). MAX() is used to retrieve a single value (scalar value) but the same results can be achieved with MIN() given the filter context applied by LASTNONBLANK and the grain of table (player-week).
An important point not to overlook is the iteration (row context) of LASTNONBLANK and thus the need to force filter context via either CALCULATE() or a measure. In this example, CALCULATE was used in the expression parameter to LASTNONBLANK to drive context transition. Moreover, you might be tempted to think you can re-use the variable even when there’s more than one player in the context (HASONEVALUE = FALSE) but this would only capture one of the players.
Wrapping Up
I hope you found something useful in this post but if not there will likely be a new post out next week on an entirely different topic. You can click ‘Follow’ to subscribe. However, as mentioned last week, upcoming presentations at Power BI World Tour – Seattle and SQL Saturday Lincoln and other obligations could slow down Insight Quest blogs over the next several weeks.

One comment