Power BI Sprint 13: DAX Measures
Recent blog posts have featured M queries related to a hypothetical Power BI project team sprint. Today’s blog post and likely several more to come will now turn to DAX measures and design patterns. For example, we’ll look at DAX variables as well as intermediate or staging DAX expressions that can support and simplify other measures.
High Discount Resellers Measure
The first task for Sprint 13 (for the team Dataset Designer) is to develop a DAX measure that retrieves a distinct count of resellers that exceed specific thresholds for at least one of two product categories – Bikes or Components. Here’s the task details:
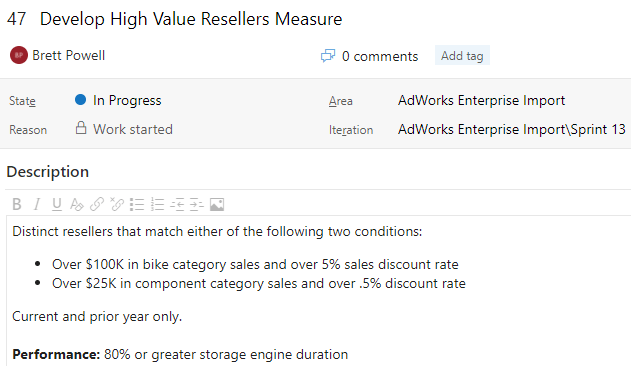
The measure will be used in exception reporting to identify the resellers driving or contributing to reduced profit margins. The sales condition ($100K for bikes, $25K for components) serves to exclude smaller resellers that won’t materially impact company margins despite high discount rates.
Results First
The DAX expression is a bit lengthy so I’ll explain a final result on the reporting canvas first. The following two Power BI table visuals have been filtered to the sales territory country of United States and the product category of Bikes or Components:
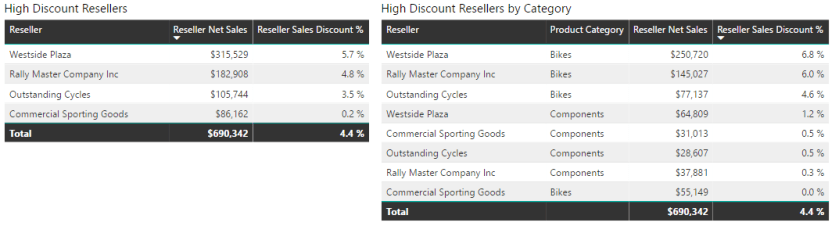
The sales territory country and product category filters can be implemented anywhere on the report such as slicers, cross-highlighting, page level filter, or report level filters. Both table visuals utilize the measure created in this blog post as a visual level filter.
With this filter and the two other filters mentioned (country, product category) in place, only four resellers are left. Most importantly, notice that Outstanding Cycles and Commercial Sporting Goods are only included because their Components sales and discounts exceed the thresholds. The other two resellers are included because their Bikes or both their Bikes and Components sales and discount rates exceed the thresholds.
As mentioned in many past blog posts, Power BI provides graphical tools to address common and relatively simple query and measure scenarios. However, when your requirements are more specific or when you’re working with larger, longer-term datasets or when you simply want full control over the solution, you quickly turn to the languages of Power BI (M, DAX) and supporting technical designs (SQL, data warehouse).
DAX Measure
The measure uses 8 DAX variables including three table variables to produce a custom table of distinct reseller keys that match the criteria. This table is then used as a filter argument to CALCULATE() to modify the filter context of a DISTINCTCOUNT() function.
High Value Discount Resellers =
/*
Resellers that match either of the following conditions:
   A) over 100K in Bike sales and over 5% discount % or
   B) over 25K in Component sales and over .5% discount %
   Current and prior year only
*/
VAR BikesSalesMin = 100000 VAR BikeDiscMin = .05
VAR ComponentSalesMin = 25000 VAR ComponentDiscMin = .005
VAR DateTblFilter =
CALCULATETABLE('Date',
'Date'[Calendar Year Status]
IN {"Current Calendar Year", "Prior Calendar Year"})

VAR BikeResellers =
FILTER(
ADDCOLUMNS(
SUMMARIZE(
CALCULATETABLE('Reseller Sales',
'Product'[Product Category] = "Bikes",DateTblFilter),
Reseller[Reseller Alternate Key],'Product'[Product Category]),
"Sales Col", [Reseller Net Sales],
"Disc Perc Col", [Reseller Sales Discount %]),
[Sales Col] >= BikesSalesMin && [Disc Perc Col] >= BikeDiscMin)

VAR CompResellers =
FILTER(
ADDCOLUMNS(
SUMMARIZE(
CALCULATETABLE('Reseller Sales',
'Product'[Product Category] = "Components",DateTblFilter),
Reseller[Reseller Alternate Key],'Product'[Product Category]),
"Sales Col", [Reseller Net Sales],
"Disc Perc Col", [Reseller Sales Discount %]),
[Sales Col] >= ComponentSalesMin && [Disc Perc Col] >= ComponentDiscMin)

VAR DistinctResellers =
DISTINCT(UNION(BikeResellers,CompResellers))

RETURN
CALCULATE(DISTINCTCOUNT(Reseller[Reseller Alternate Key]),DistinctResellers)
Measure Design
At a high level, the measure simply executes the following logic:
- Create a filtered and grouped reseller table for the bike category
- Create a filtered and grouped reseller table for the components category
- Combine the tables from Steps 1-2 into a single table of distinct resellers
- Filter a distinct count expression based on the table in Step #3
Variables are used to break out and simplify the logic. More importantly, the measure respects the filter context of the Reseller Sales fact table such that filters on related dimension tables (ie Promotion, Sales Territory) will impact the measure.
- The business key (Reseller Alternate Key) is used rather than the primary key due to a slowly changing dimension process that generates new rows for resellers as certain attributes of the reseller change over time.
- The SQL view used for the Date dimension table dynamically calculates values for a Calendar Year Status column (Current Calendar Year, Prior Calendar Year).
- If this wasn’t available, the current and prior year could be computed within the measure and passed as filters to the Calendar Year column.
Table Functions From the Inside Out
The BikeResellers and CompResellers follow the same design of building to the target table via four table functions:
- CALCULATETABLE() to implement the date and product category filters.
- SUMMARIZE() to group the resellers for the respective product category.
- ADDCOLUMNS() to execute the measures (sales, discount %) against the resellers.
- FILTER() to reduce the table of resellers to those that match the condition (either for Bikes or Components).
- The threshold variables are passed as the conditions to FILTER().
Note: At the moment we can’t use SUMMARIZECOLUMNS() within DAX measures. We can and should use this function rather than SUMMARIZE() in all other DAX queries.
Once step 4 (FILTER()) has executed, we simply need to stack the two tables on top of each other (via UNION()) and then remove any duplicates via DISTINCT(). (Unlike SQL, the UNION() function in DAX does not remove duplicates).
Performance Considerations and Test Results
- The storage engine queries are reduced by embedding the simple filter conditions into the table parameter of SUMMARIZE() via CALCULATETABLE().
- ADDCOLUMNS() is used to execute the measures against the resellers rather than the third parameter to SUMMARIZE().
- The results of ADDCOLUMNS(), which reflects the original filter, are used by the FILTER() function. We don’t query the storage engine again.
Let’s look at the measure in DAX Studio:


Executing the measure by itself results in 96% storage engine duration and grouping it by sales territory country (a common query) results in 87% storage engine duration. In this example, the Reseller Sales fact table has 4.4M rows. In most report queries, other filters will be applied such as slicer selections on country or a specific time period and this will reduce the size of the reseller variable tables iterated over.
An additional optimization to consider is separating the FILTER() operation into two FILTER() functions. One FILTER() would apply the sales condition (e.g. Sales >= $100K) and the other FILTER() would apply the discounts condition (Discount Rate >= 5%). The idea here is to further reduce the number of resellers in which the measures are executed against.
A few takeaways
- Similar to temporary tables (derived tables, CTEs) in SQL, you can use DAX query functions to modify the filter context of DAX measures.
- You always want to implement your simple, restrictive filters up front and thus minimize the impact of more complex conditions (such as with measures).
- DAX variables are your friend for custom, complex measures.
- Table variables and variables referencing variables opens many doors.
- Don’t forget about set-based DAX functions like UNION(), INTERSECT(), and EXCEPT().
Insight Quest Update
- I’ll be traveling next week (Thanksgiving here in USA) and therefore I may not have another blog post until the following week.
- Chapter 4 of Mastering Power BI wrapped up yesterday. I think some of you will appreciate the DAX, M, PBI Planning, and other topics and examples thus far.
- There were a few DAX query-based measures included in the Cookbook, too.
- Site statistics clearly indicate that viewers like more technically detailed blog posts.
- See the Buy a Blog Post page and other pages under the Frontline Analytics dropdown if interested in a specific topic.
