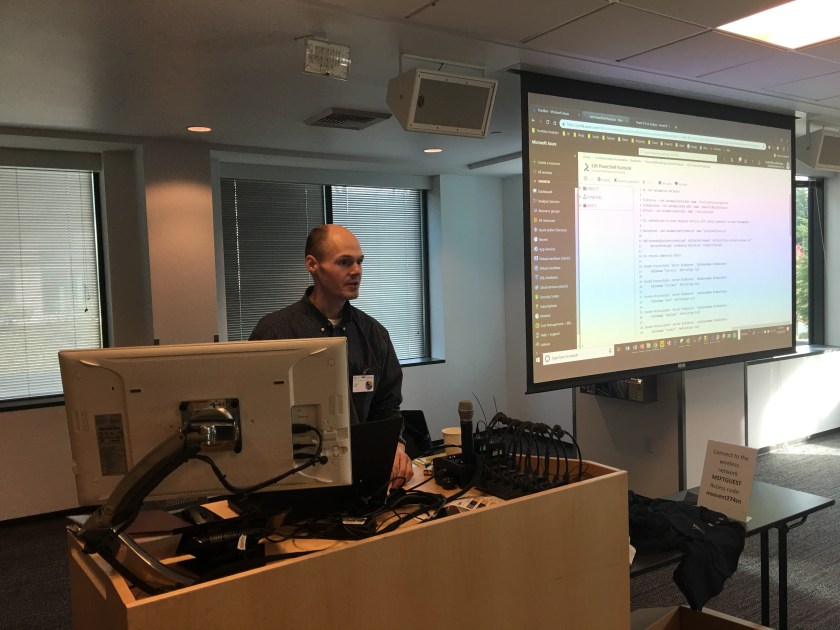
In this week’s episode of Insight Quest, Brett, the team’s lead BI developer and admin, has returned from a trip to the Power BI World Tour in Seattle and been assigned the following three work items as part of the current sprint:
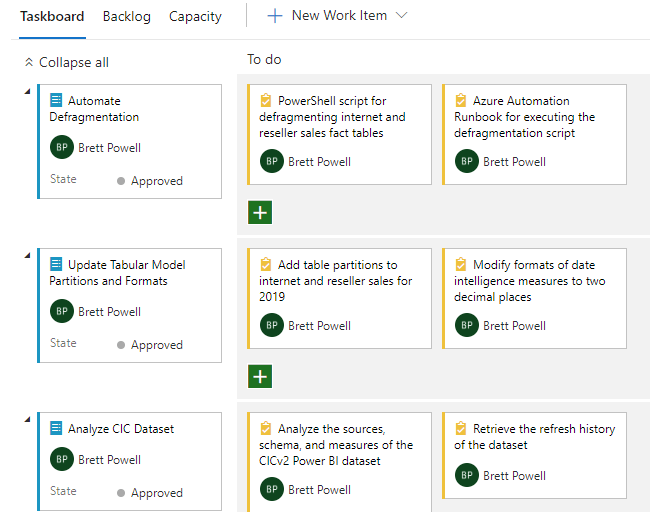
Work Item Overview
The post will walk through each item in detail but here are the essentials:
- The current Azure Analysis Services Tabular model’s two fact tables, internet sales and reseller sales, are partitioned by year but don’t have partitions for the upcoming year of 2019.
- Since only two full years of history are required, the team will be dropping the 2016 partitions in January of 2019 and wants to defragment the fact tables following this operation.
- Defragmenting updates the dictionaries of the columns in these tables such as removing values that were exclusive to the partitions now deleted. This helps to save resources and maintain query performance.
- A business team has internally developed a Power BI dataset (CICv2) which has proven to be very popular but there have been issues with the reliability of the scheduled refresh and questions regarding the business logic it contains.
- The intent is just to gather essential data points about the dataset such as its sources, schema, owner, size and refresh history such that the team will be in a better position to support or migrate the dataset in the future.
The following technologies will be used to perform the assigned tasks:
Work Item #1: Table Partitions and Measure Formatting
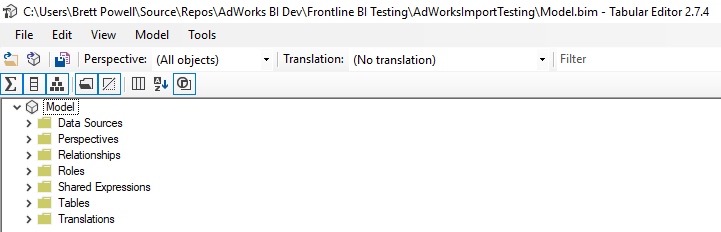
Many past blog posts have utilized Analysis Services Projects in SQL Server Data Tools (SSDT) for Visual Studio as the primary tool for designing Tabular models. However, in this example and likely going forward, the open-source Tabular Editor will be used instead. This is based on the increasing maturity and robustness of Tabular Editor as well as recent guidance from Microsoft that Power BI Desktop will eventually become the flagship design tool for enterprise-grade analytical models.
- Open Tabular Editor and connect to the Model.bim file for the existing Analysis Services Tabular Model project.
Tabular Editor - Navigate the model’s hierarchy to the partitions for the Internet Sales table and create a partition for the year 2019 via the Power Query option per the following image:
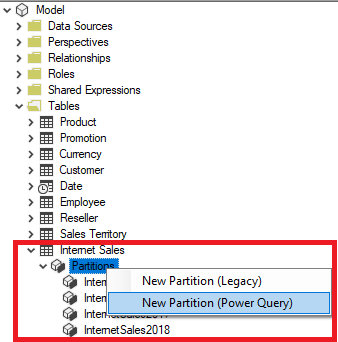
Table Partitions The expression editor window and properties dialog for the new partition make it easy to set the partition’s name (InternetSales2019) and to author its Power Query (M) expression. Create the ResellerSales2019 partition and save (Ctrl +S) to apply these edits to the Model.bim file.
- Navigate to the display folder containing the date intelligence measures and multi-select measures expressed in currency per the following image:
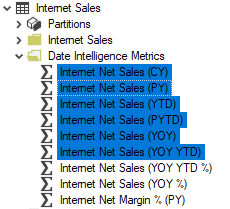
Multi-Selected Measures With the measures to be modified selected, use the Format String property in the properties window to set the format to display 2 decimal places. Notice/confirm that this metadata change has been applied to each of the measures selected. Save (Ctrl+S) to apply these changes back to the model.bim file.
Close out of Tabular Editor and open up the Visual Studio solution containing the Analysis Services Tabular project. Right-click the Model.bim file and select Compare with Unmodified to note the changes (diff) implemented via Tabular Editor:
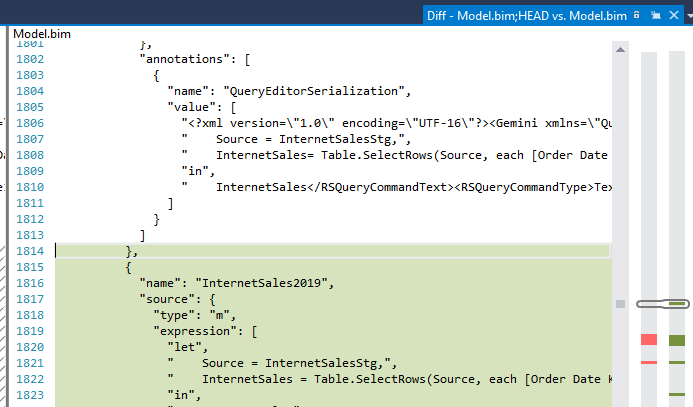
The green and red colors on the right locate the changes/editions to the model. In this case, the colors reflect the two new partitions for the year 2019 and the changes in formatting to the date intelligence measures. Commit the changes and the deploy the model to the Azure Analysis Services instance (the management server).
Work Item #2: Script and Automate Defragmentation
- Use the Invoke-ProcessTable cmdlet of the SqlServer PowerShell module to author the core table defrag operations of a PowerShell script such as the following example:
$TabularServer = "ATLAS"
$TabularDatabase = "AdWorksImport"

Invoke-ProcessTable -Server $TabularServer -DatabaseName $TabularDatabase `
    -TableName "Internet Sales" -RefreshType Defragment

Invoke-ProcessTable -Server $TabularServer -DatabaseName $TabularDatabase `
    -TableName "Reseller Sales" -RefreshType Defragment
- In the Azure Portal, navigate to the Azure Automation resource and ensure that the necessary credentials and variables are set for authenticating to Azure Analysis Services and executing the defrag operations.
-
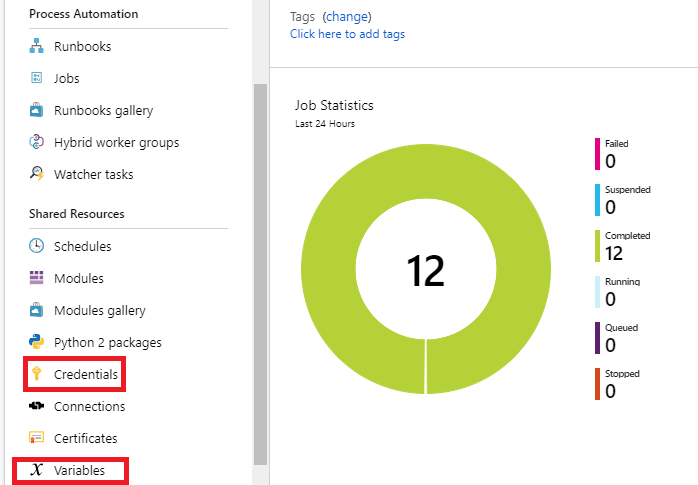
Azure Automation Dashboard in Azure Portal
If the defragmentation script and perhaps a few other scripts were the only scripts that needed to be executed via Azure Automation, shared resources of Variables and Credentials may not be necessary. However, assuming Azure Automation will become a central hub for automation and orchestration, securely storing these assets for re-use across many scripts (Runbooks) is recommended.
In this case, the service principal (and its key as password) with rights to the Azure AS resource is stored as a credential and several variables are stored as well including the tenant ID, resource group name containing the Azure AS resource, the processing server (management server) of the Azure AS resource, the Azure AS region, and more.
-
- Create an Azure Automation Runbook including the authentication syntax leveraging the stored credential and variables in Azure Automation:
#1. Get Automation Variables

$TabServer = Get-AutomationVariable -Name 'FrontlineProcessingServer'
$TabDatabase = Get-AutomationVariable -Name 'AdWorksTabularDatabase'
$Tenant = Get-AutomationVariable -Name 'FrontlineTenant'
$AzureRegion = Get-AutomationVariable -Name 'AzureASRegion'

#2. Authenticate to Azure Analysis Services with stored credential in Azure Automation

$AzureCred = Get-AutomationPSCredential -Name "AzureASRefreshCred"

Add-AzureAnalysisServicesAccount -RolloutEnvironment $AzureRegion `
    -ServicePrincipal -Credential $AzureCred -TenantId $Tenant

#3. Execute process defrag of internet and reseller sales tables in separate transactions

Invoke-ProcessTable -Server $TabServer  -DatabaseName $TabDatabase `
    -TableName "Internet Sales" -RefreshType Defragment

Invoke-ProcessTable -Server $TabServer  -DatabaseName $TabDatabase `
    -TableName "Reseller Sales" -RefreshType Defragment
Execute the script against a small, test Tabular database and, assuming success, schedule the runbook to be executed for after the 2016 partitions will be deleted. Depending on the size of the model and whether the management/processing server is included in the query pool, the defrag operation should be scheduled during a period of relative low utilization.
Work Item #3: Power BI Dataset Analysis
- Identify the app workspace and dataset GUIDs of the given Power BI dataset based on the known names of these objects.This assumes the user running the following PowerShell script has been assigned to the Power BI service administrator role and has the Power BI Management module of PowerShell cmdlets installed.
Connect-PowerBIServiceAccount
$DatasetName = "CICv2"
$AppWorkspace = "CIC"
Get-PowerBIWorkspace -Scope Organization -Name $AppWorkspace
Get-PowerBIDataset -Scope Organization -Name $DatasetName
2. Use the dataset ID retrieved in step 1 to obtain the refresh history of the dataset via the Invoke-PowerBIRestMethod cmdlet:
$CICv2DatasetID = "fbf18326-fc71-4e7a-97da-79a7a1124eb1"
Invoke-PowerBIRestMethod -Url datasets/$CICv2DatasetID/refreshes -Method Get
This will provide the start and end times of the refreshes as well as the status of the refresh (e.g. “Completed”) and whether the refresh was scheduled or executed ad hoc (onDemand).
3. If necessary, add yourself as member of the workspace via the Add-PowerBIWorkspaceUser cmdlet (applicable to the new workspaces, currently in preview). Download the CICv2 dataset.
Note: Once XMLA endpoints is enabled for Power BI Premium workspaces, if the CICv2 dataset was hosted in premium capacity it would be possible to analyze/browse the model just like an Analysis Services model without needing to access the PBIX file itself.
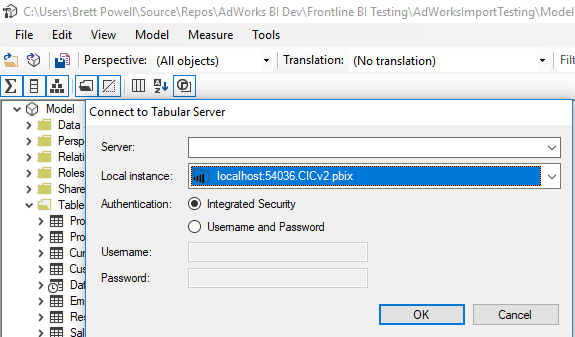
4. Connect to the Power BI Desktop file from Tabular Editor to analyze the tables, relationships, measures, etc:
Wrapping Up
Thanks for your patience in waiting for a new blog post. It was a pleasure to speak at SQL Saturday Lincoln (Nebraska) and the Power BI World Tour in Seattle but I’m also glad to be back in Boston (home of the World Series Champions). This month (November, 2018) is expected to be a major month for Power BI so I’ll look to highlight a few of the announcements/releases with blog posts to close out the year.