This blog post provides two Power BI templates (one import, one DirectQuery) which query common dynamic management views (DMVs) used to monitor Azure Synapse Analytics. Visualizations provide high level visibility to active (or recently active) sessions, query executions, and waits (if any). Three detail report pages are included to support deeper analysis such as retrieving the specific SQL command associated with a wait or long running query.
Requirements
You’ll need the following to use these templates:
- An Azure Synapse Analytics (formerly Azure SQL DW) resource or a parallel data warehouse (Analytics Platform System).
- This is not applicable to SQL Server database, Azure SQL database, or Azure SQL database managed instance
- View Database State or Control permission on the database is required
- If you don’t have at least View Database State, you’ll need to request permission:
- GRANT VIEW DATABASE STATE to TheUser;
- If you don’t have at least View Database State, you’ll need to request permission:
- A recent version of Power BI Desktop
- The templates were built with the April 2020 version
- Finally, you’ll (of course) need the server and database name and your authentication credential
You can download the templates and the four SQL queries used in the templates from my GitHub repo.
Template Overview
Upon opening the template, you’ll receive the typical input form to provide the server and database name:

Upon clicking ‘Load’ you’ll either need to provide your credentials for this source (if you don’t have this data source saved from previous use) or the queries will execute and the following report pages will be available:
- Executions
- Waits
- Sessions
- Waits Detail
- Execution Detail
- Memory
- ExecutionDrillThrough (hidden)


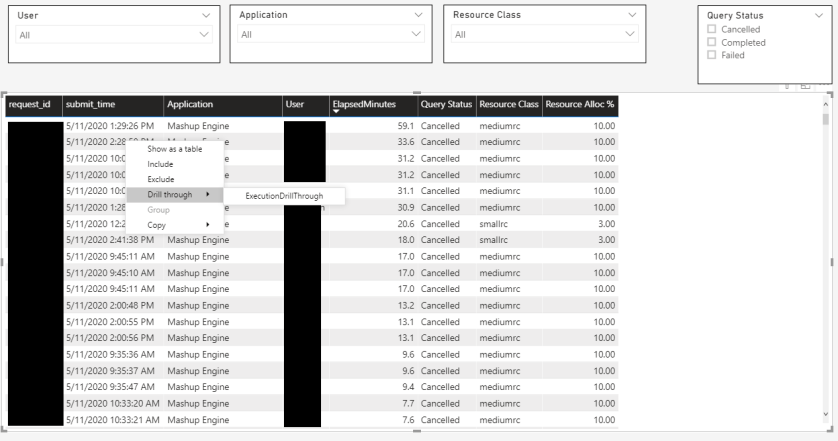
The above slideshow excludes the Waits Detail and ExecutionDrillthrough pages. Throughout the pages you can use either the Filter pane and/or a slicer to apply selections. Per the Execution Detail image, you can right-click the query (request ID) and navigate to the ExecutionDrillThrough page to provide details on this particular request.
Use Cases
It’s outside the scope of this post to describe what a ‘wait’ is (they’re bad) or how you should interpret these report pages in any detail. You might think of the report as a snapshot of activity on the database now (or very recent past) as the DMVs are limited to the last 10,000 logins (sessions) and 10,000 queries (executions).
Nonetheless, you might use the template to:
- Know who is currently active and with what resource class
- Identify any long running queries and/or waits
- Understand which applications are being used
- Mashup Engine and .Net SqlClient Data Provider represent two types of queries from Power BI, for example.
- Determine if the compute nodes on the resource have available memory (or are maxed out)
- Retrieve the specific SQL query associated with a Wait or long running query for further troubleshooting
A few extra details…
The T-SQL queries use the DATEADD function to adjust the Azure UTC timestamp back 4 hours. Additionally, the queries are filtered for the current date (when adjusted from UTC. Therefore, you’ll need to open the Power Query Editor and revise the hour interval from UTC that’s appropriate for you.
The new COALESCE DAX function is used to replace blanks with zeroes and there’s some CASE expression logic to combine SQL Server Management Studio application names into a single ‘SSMS’ app name.
If the visuals fail to render for the DirectQuery template, just save the file as a .pbix and open it again.
To go beyond the limited history available with these DMVs, you might consider enabling Query Store and using its DMVs as your source.
I would typically use the DirectQuery version rather than import to avoid data refresh and given that these are simple queries with any transformation logic built into the T-SQL. If you wanted to implement transformation logic via Power Query (M) or if you needed DAX functions not supported in DirectQuery mode this would lead you to the import version.
Wrapping Up
I hope this template gives you some ideas of utilizing Power BI and Synapse DMVs to monitor your Azure Synapse Analytics Workload. Thanks for visiting Insight Quest and just click ‘Follow’ to receive notification for future posts.

4 comments