This blog post describes a Power BI template that analyzes the quality of rowgroups within columnstore indexes in Azure Synapse Analytics. The template provides two report pages (Summary, Details) which help to quickly discover whether an index is well-compressed and ‘healthy’ or if it may need to be rebuilt to deliver optimal query performance.
Why does this matter?
The quality of columnstore index rowgroups directly impacts the performance of queries, such as the queries coming from Power BI DirectQuery datasets and other tools. Fewer overall rowgroups, less Open (rowstore, uncompressed) rowgroups, and more optimally compressed rowgroups (max of 1,048,576 rows) means that queries will have less to read and thus will execute faster.
In many scenarios, an index will be be optimized for a period of time but the team responsible for loading the data warehouse may fail to establish a process for rebuilding the indexes after these data loading operations. Similarly, there could be a high volume of DML operations executed to insert/update/delete historical data that causes rowgroup quality to decline. Failure to monitor, identify and resolve index quality issues could lead to a number of costly and misinformed decisions such as provisioning more Synapse SQL DWUs or utilizing more Power BI Premium capacity memory (import mode) than otherwise necessary.
A good practice is just to regularly rebuild the columnstore indexes for the partitions which are being impacted by scheduled load processes and to rebuild the indexes for the partitions impacted by data modifying operations. A one-time rebuild of all the partitions of the index may be necessary initially if the index hasn’t been maintained. Additionally, you should have some baseline BI queries you can run against the tables to compare performance before and after the index rebuilds so you can prove that the index rebuilds (rowgroup quality) matters.
The Template
You can download the template from my GitHub repository.


Upon opening the Power BI template you’ll be prompted to provide values for up to six parameters though only one table (Table1) is required. Provided that you have necessary permissions (View Server State) to run the sys.pdw_nodes_column_store_row_groups Synapse SQL pool catalog view, a recent version of Power BI Desktop, that your tables actually use columnstore indexes, and of course that you have the full server name (abcserver.database.windows.net) and everything spelled correctly, a T-SQL statement should execute against your database to retrieve rowgroup data for visualization as depicted in the images.
This template builds an import mode dataset. If you want DirectQuery, you’d need to refactor the queries in the Power Query Editor.
Summary Page
The summary page should give you a quick overview of the quality of an index’s rowgroups such as whether a high % of the row groups are Optimized or if their not optimized or open. A derived attribute (Size Group) groups the rowgroups into one of five buckets to give a sense of the distribution of the rowgroups. If you see a high number of small rowgroups (0 to 200K, 200K to 400K, etc), you’ll probably want to find what partitions these rowgroups are in and rebuild the index for this partition.
If you retrieve index rowgroup data for multiple tables, you’ll generally want to use the table name slicer in the top right corner of the summary and detail pages to view one table at a time. And yes, I’m aware that donut charts are not considered a data visualization best practice. However, in this scenario with just 3-4 distinct values and with detailed labels I think it’s better than a bar chart.
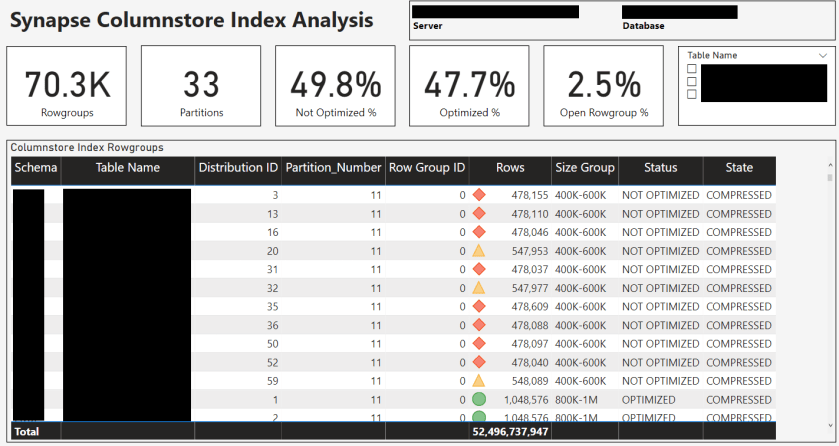
Details Page
The Details report page includes the card visualizations as the Summary page but includes the individual rowgroups in a table visual for more granular analysis and to support data exports. There are several attributes for filtering in the Filter pane such as size group, status, and state description and there’s some simple icon-based conditional formatting to help call out the small rowgroups that may represent a problem.
If a very high percentage of your rowgroups are not optimized and are in the smaller row group sizes you might check that you’ve sized your partitions correctly for the given table and ensure that you’re not over-partitioning.
Wrapping Up
If you’re using columnstore indexes in Azure Synapse Analytics I hope you find this template useful. You might consider adding columnstore index analysis to the Synapse monitoring template as part of a broader admin/monitoring solution.
Thanks for visiting Insight Quest and if you like this content you can subscribe to get an email notification for future posts.

thanks for useful theme, but, i think it`s necessary to include real examples for people that need material solution. I don`t talk about done procedure, but at least select`s from system views fro this problem is needed.
LikeLike