Complete Solution
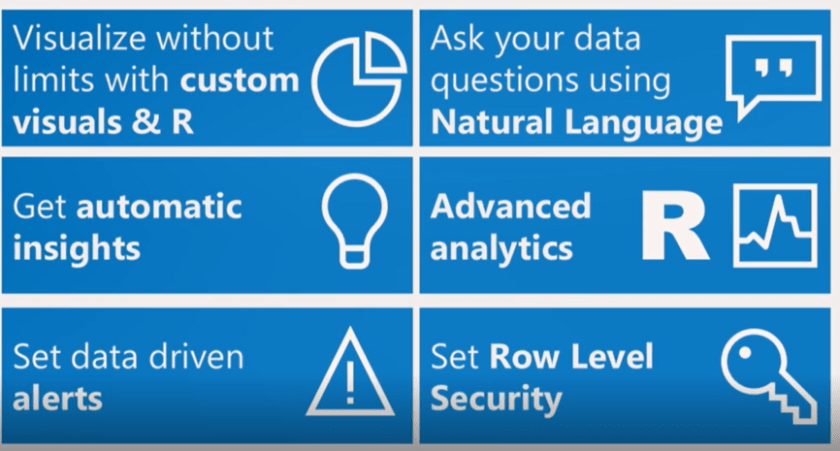
In the MS Ignite session Innovate with MSBI in the Enterprise, Kamal Hathi, GM for Power BI, introduced the following slide as ‘BI on your Terms’ and provided a summary of each stage of the lifecycle (Model, Author & Analyze, Deliver, and Consume).
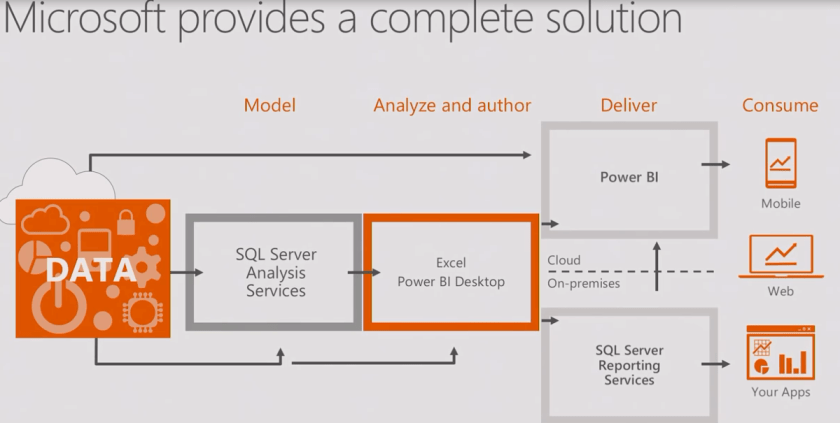
The content of this post will focus on the highlighted Excel and Power BI Desktop client authoring tools but I think this slide is important to introducing this topic as it implies the following points:
- SSAS (Tabular) is the modeling engine of MSBI and the scalability (ie partitions) and manageability features it provides makes it essential for corporate MSBI Solutions.
Yes, you can and should build models in Excel and Power BI Desktop and you can obtain great value from the small scale models (e.g. detailed feedback, rapid iterations) contained within these files (or perhaps larger data sources via direct query in PBIX) but ultimately, if the model represents an important business process and/or common business entity (employee, region) any BI organization would prefer (or require) that this data conform to the data warehouse architecture and data governance policies.
Note: If an SSAS Tabular 2016 development server instance is available and the data transformations required could be handled with SQL queries I’d choose to even start a POC/Pilot project with a Tabular model rather than PBIX. If you determine that a series of Power Query/M functions are needed then you can get going with PBIX in the short term but preferably the need for this light ETL package can be eliminated with a DW project in the future and for now SSAS doesn’t support Power Query/M as was planned for SSAS 16′:
 *I know I keep mentioning this but it’s just a critical issue with MSBI currently and I’m not aware of any timeline for when it will be ready for any of the tools (SSAS/SSIS/SSRS).
- It’s Excel AND Power BI Desktop, not Excel OR Power BI Desktop for a complete solution.
Per the Insights Summit and Ignite sessions I’ve referenced in recent posts these two client tools have distinct advantages, use cases, and complement each other very well. You can obtain high value from just choosing one but you obtain more value from using both tools and a complete solution when they’re both used together against an SSAS modeling engine.
For example, you ‘could’ exclusively use Power BI Desktop as your authoring tool but it won’t take very long to run into requirements and use cases that any self-service exploratory visualization tool isn’t well suited for. Likewise, if you wanted to leverage existing Excel assets and avoid the added complexity of multiple authoring tools, you could go down that road and you’d soon run into limitations and gaps that Excel isn’t intended to resolve.
- SSRS 2016 is part of a complete solution too, on-premises deployment or not.
SSRS is completely re-built in 2016 and is important even before Power Query integration and even when an organization uses Power BI for mobile experiences rather than the new SSRS mobile reports (from Datazen). In this scenario, the ability to publish and pin SSRS elements to Power BI would/will also be part of a complete solution in addition to PBI and XLSX artifacts.
So if someone says “Power BI can’t do that” it’s often just based on a confusion between Power BI and MSBI, the latter as depicted in Kamal’s diagram above being required for a complete BI solution. (Note: Data Warehouse, ETL, and MDM solutions all of course benefit these BI tools like any other)
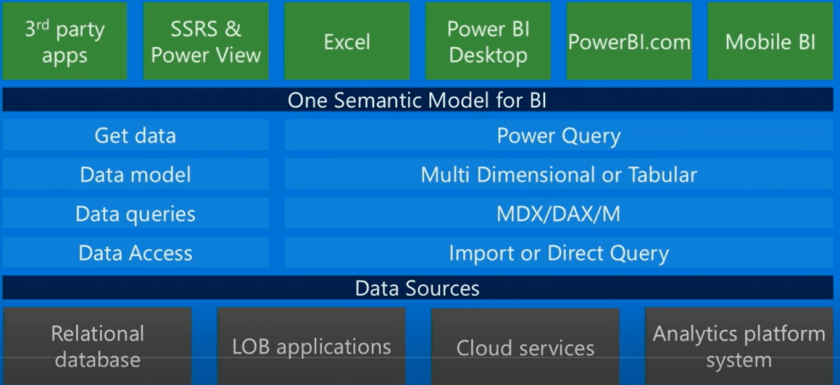
I found the following slide from the Data Insight Summit that consolidates the different tools including Power View and prominently features Power Query and the M functional language for data retrieval:
Excel 2016
Let’s start with some of the distinct advantages Excel brings to the table per the Power BI team:
- Leveraging existing Excel assets is the quickest way to start using the Power BI service
- Simply upload a workbook, set a scheduled refresh, interact in the browser via Excel Online, share it with others via the same Power BI sharing/distribution methods available to native Power BI reports
- Use Power BI Publisher for Excel to pin Excel items to Power BI dashboards
The following slide was referenced at MS Ignite in the session ‘Boost your business insights by using Excel with Power BI’
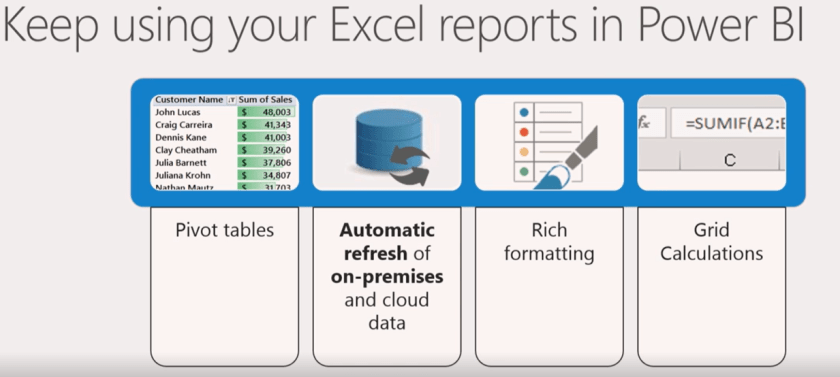
At the Data Insights Summit in March, the ‘Excel and Power BI are Better Together’ session also included cube functions and VBA automation. So the consolidated list of unique Excel strengths are:
- Pivot Tables
- Cube Functions
- Grid Calculations
- Rich formatting of tables and charts
- VBA for Excel
These are indeed some of Excel’s top strengths and the items listed can all work together seamlessly without any VBA code producing a higher value than the sum of the individual parts. For example, it’s common to see a single report page (worksheet) in Excel contain a richly formatted table/matrix based on functions and/or cube functions, some of which reference a pivot table, 1-2 pivot charts sourced from a pivot table, functions driving conditional formatting rules, and an interactive slicer (or 4-5) filtering all or part of the report. Therefore, the 4-5 bullet points of Excel could be consolidated into a single ‘analytical flexibility’ item.
In the context of the MS Ignite and MS Data Insights sessions (with so much material to cover) I can understand this summary and I’m sure there was no intent at all to slight Excel or those that use it. However, I also think this brief summary oversimplifies and understates the value of Excel, in some cases entirely missing important features distinct to Excel.
Here are several other features and considerations with Excel:
- Fully supported upgrade path to SSAS Tabular and SharePoint
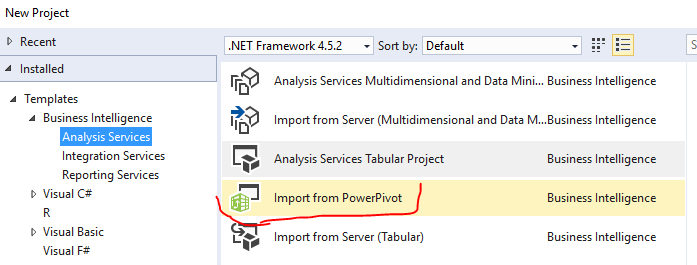
Note: There IS a way of migrating a Power BI Desktop model to SSAS Tabular (if Power Query/Query Editor isn’t used) but it’s not supported and involves several steps including scripting in SSMS.
If you can keep your data transformations within SQL statements, you can easily import the file to an SSAS Tabular database. If it’s part of your BI infrastructure, you can also use Power Pivot for SharePoint to provide further scale, collaboration, controls and monitoring.
You can review the Deploying SQL Server 2016 PowerPivot and Power View in SharePoint 2016 whitepaper for more info. Note the Power Query integration mentioned on page 5 of this document “Furthermore, in SharePoint 2016, users soon can configure Scheduled Data Refresh for Excel workbooks that utilize Power Query connections to import data into a data model.”
- Excel is its own programming language (a functional language like M and DAX) with worksheets as a development surface area and the workbook (with charts, pivots, etc) as an integrated development environment.
The fact that a scrollbar is needed to traverse the different categories of Excel functions gives you an idea that Excel is ready to work with data in just about any scenario imaginable.
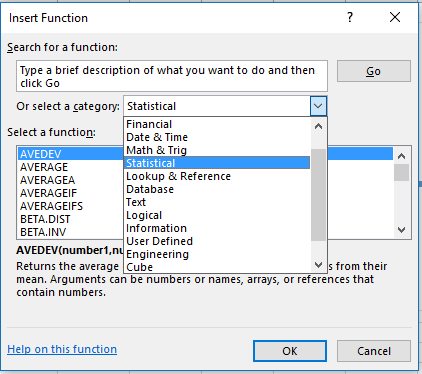
*Power Query/M and DAX should greatly replace reliance on Excel ‘grid’ functions but there are certainly use cases for the cell level control you have with functions.
At Insight Summit Rob Collie presented the following Excel report that the president of a publicly traded company enthusiastically endorsed:
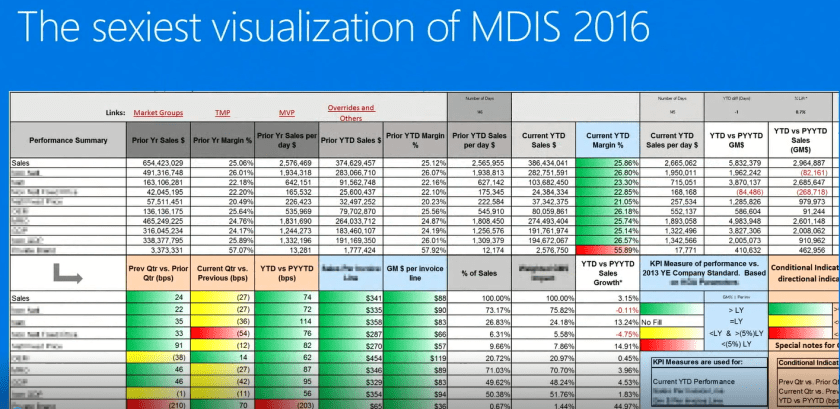
His main point from this slide was that ‘having the numbers’ (measures) is more important than how the numbers are presented.
He didn’t go into details but I think we can assume he mixed DAX measures with Cube Functions (MDX), and applied custom conditional formatting rules for certain ranges. He may have also used other Excel functions (not just cube) as well in addition to any M functions.
Myself and many other MSBI consultants can surely attest to the reality that number-dense, tabular representations with custom formatting rules such as this example are a common, important requirement in BI projects. They don’t replace interactive reports or dashboards but they are valuable assets.
- Analytical Formatting
It’s not just the comprehensive control over aesthetics such as borders and the chart axis – Excel makes it relatively easy to implement custom business rules/logic to conditionally drive the formatting of reports similar in function to KPIs.
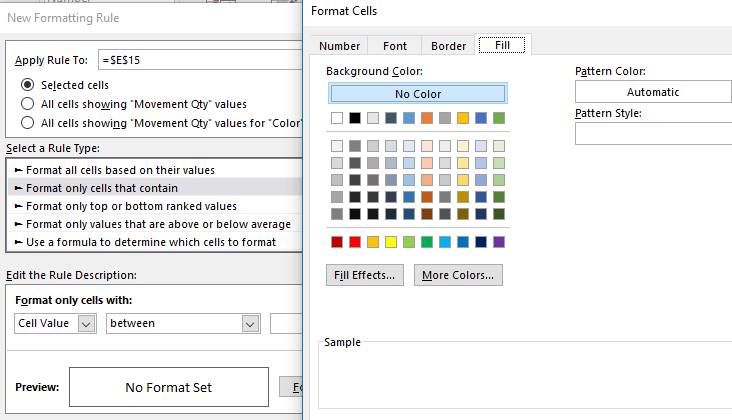
Conditional formatting has been added to Power BI Desktop currently only basic/generic rules can be applied. (Color Saturation and tooltips in Power BI does help offset though)
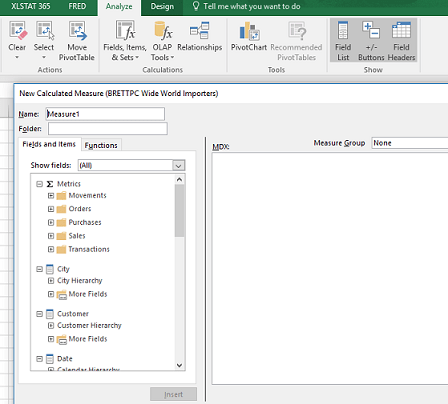
- OLAP Tools – Calculated Members and Measures
Per the following blog post regarding Excel 2013 and later versions, you can create Calculated Members and Measures within Excel on top of the existing members and measures available from a source SSAS instance. You can also create named sets based on row/column items whether the model is local to Excel or an SSAS model.
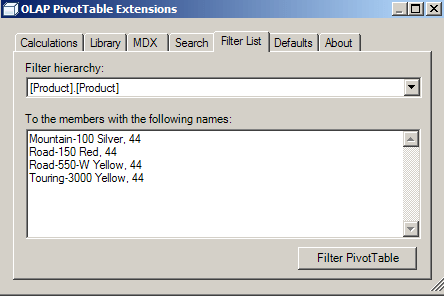
- OLAP PivotTable Extensions
A free download, this add-in makes it easy to retrieve the MDX queries used by your reports, search for dimension members and metrics, and you can also filter a pivot table by a list of values you could simply paste into the dialog per the following image.
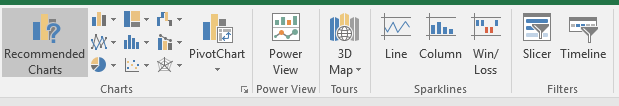
- Visualization Options
Although visualization isn’t a primary mission for Excel like with Power BI, with Excel 2016 there are many visualizations to choose from including the new chart types and forecasting I’ve recently blogged about, the standard charts you can create quickly via pivot, Power Maps is now a built-in feature, Power View (hidden by default) is also still very much available and can be rendered in Power BI. Sparklines can supplement reports and interactive slicers which, unlike Power BI, can optionally be used to filter other report pages.
Note: We also know that new mapping/geospatial capabilities are coming to Excel soon.
When you consider the custom control and rich formatting you can apply to many of these visualization options previously mentioned, as well as third party add in visuals and your options for feeding these visuals from DAX, Cube Functions, and Excel functions you see that Excel is often very underrated for its data visualization.
There are still many organizations for whom Power View and these other visualization options represent a step forward from their current state. There are also other organizations who may already have a 3rd party visualization tool in place and thus getting the most out of Excel in visualization to support collaboration and analysis is important.
- Measure Dialog Box
When authoring new DAX measures via Power Pivot for Excel you have the following dialog with access to supporting DAX function syntax. You also have a ‘Manage Measures’ button that makes it easy to find and edit existing measures with this same measure dialog and the Check formula button further supports a productive metric authoring experience.
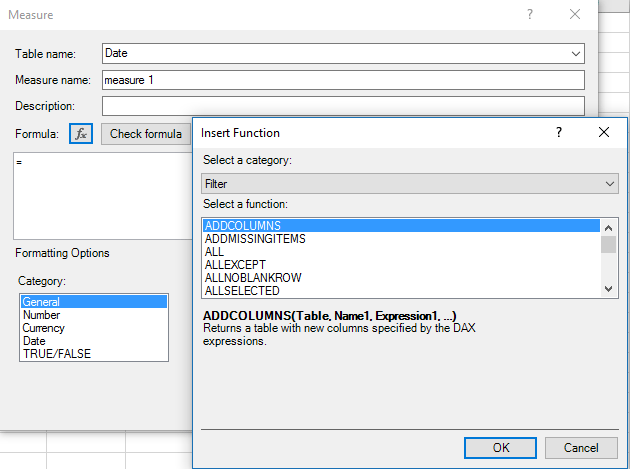
Power BI Desktop doesn’t currently have measure authoring and management features like this.
- Portable Perspectives and KPIs
Power Pivot for Excel has the same KPI authoring capability as SSAS Tabular:
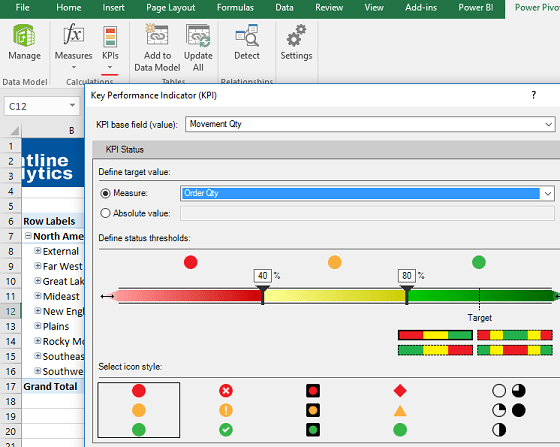
Power BI Desktop has very good KPI visuals but the KPIs defined in the Power Pivot experience are portable to SSAS and Power Pivot for SharePoint.
Perspectives aren’t necessarily a major benefit to Excel when the model is still local to Excel as you can’t browse a perspective outside of the Power Pivot Data Model window. However, like with KPIs, the perspectives you define in Power Pivot can definitely be used by client tools connecting to the upgraded model in SSAS and SharePoint.
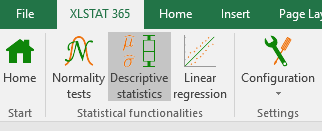
- Additional 3rd Party Add-ins Available for Excel
There are many powerful add-ins available to further extend Excel. One example featured at MS Ignite 2016 is XLSTAT 365 for applying various statistical analyses within Excel:
One more example is the Federal Reserve Economic Data add-in.
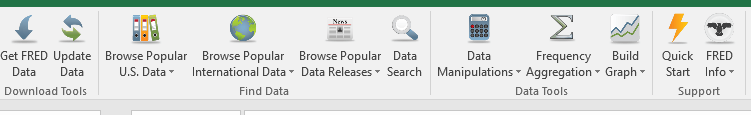
Developers and 3rd parties have a huge audience to target with Excel and integrating the visuals and analytics into Excel can significantly extend its utility.
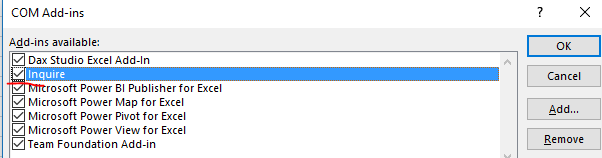
- Excel Manageability and Validation
Did you know Excel has powerful tools (both client and server) for validating and auditing its workbooks? Even without the server products, Inquire itself provides a way of managing the complex analytical applications Excel takes on.

Note: You need to enable the Com Add in:
There’s not currently any internal auditing/validation tool available for Power BI Desktop.
The following presentation from Ignite goes into great detail on Inquire and few of the other tools:
Power BI Desktop
What are the incremental benefits or unique advantages of Power BI Desktop per the Data Insights and Ignite conferences?
*From the ‘Boost your business insights by using Excel with Power BI’ presentation at MS Ignite 2016
Similar to the list of unique Excel strengths, this is a great summary of top differentiating features of Power BI for the context of the one hour presentation. However, also like the Excel list, I think it understates or misses several important report authoring aspects that are unique to Power BI Desktop.
Some of the top additional features and considerations with Power BI Desktop are as follows:
- A More Integrated Model and Reporting Authoring Experience
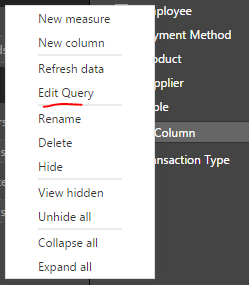
In Power BI Desktop, the query editor, model, and reporting/visualization canvas all talk together. In many common scenarios, the user doesn’t have to leave the context of the report canvas to implement a change (column rename, hierarchy, metric format) that’s automatically propagated back through the other components.
You can also more quickly jump or toggle between the different components. In the example below, a simple right-click from the report canvas provides access to the Query Editor view of the given table.
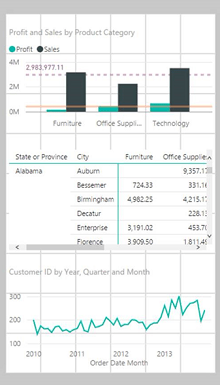
- Made for Mobile Reports
Even without mobile layout adjustments in Power BI Desktop PBIX files can look very good on mobile devices. With the September Power BI update you can now customize how your Power BI Desktop report will appear on mobile devices:
- Bidirectional cross-filtering
Support for Many-to-Many relationships and other analysis scenarios this feature enables is a top new feature of SSAS Tabular 2016 and is not currently available in Excel 2016 (filters only flow from 1 to many). The following white paper from the SSAS team has all the details.
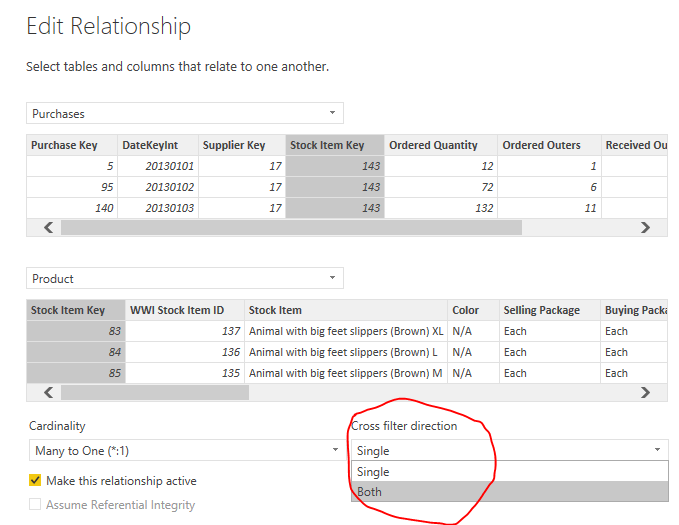
Apparently the Excel team will be able to add this feature but there’s no timeline yet. In the absence of bi-directional cross-filting, Excel users can use the CROSSFILTER function on a per measure basis and other DAX M2M work-around patterns.
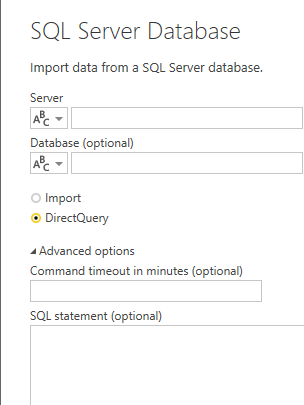
- Direct Query
The ability to create a direct connection to many common data sources (SQL Server, Oracle, Teradata) is a massive advantage for Power BI Desktop over Excel 2016 as it removes both the scalability bottleneck of the local file’s size (1GB max for upload to PBI) as well as the latency and version control issues that go along with scheduled imports/refresh.
If the data source schema has referential integrity (e.g. the product ID in every sales row has a related product ID in your product dimension) then you can also configure Power BI Desktop to assume referential integrity and thus improve query performance via inner join SQL statements. (I’m not aware of any plans or even rumors where Direct Query would be supported by Excel)
- Super DAX Performance
Power BI Desktop visuals leverage all the enhancements that were part of the Super DAX project and thus will generally result in significantly better performance than Excel’s MDX queries. The queries sent by these visuals leverage DAX variables and the latest DAX functions (e.g. SUMMARIZECOLUMNS) to help produce optimal query plans and minimize the # of storage engine queries needed.
Note: MDX client performance is also improved, including for Direct Query mode, but not as much as Power BI DAX client. It should also be noted that Excel 2016 workbooks now send much faster queries to OLAP sources.
- DAX Tables (Calculated Tables)
Just like SSAS Tabular 2016, you can use a DAX table function against the model contained within PBIX and use the results of this table just like any other table in the model.

Although you’d generally want to avoid calculated tables for similar reasons as calculated columns, there definitely are important use cases for them to simplify analysis or improve performance. This option in PBIX and SSAS Tabular is far superior to the Power Pivot for Excel method I walked through in the previous post as that entailed loading an uncompressed Excel data table.
- Parameters and Templates
Parameters are exclusive to Power BI Desktop and allow authors to make the report’s data retrieval and analysis dynamic based on a user’s input or other conditions at run time. Templates are a great way to leverage the metadata from one file for other reports thus applying a common layout/design.
The following video provides a good overview of parameters and templates:
There have also been many excellent examples and posts on integrating parameters (with M functions, tables, DAX, etc) – I try to review Chris Webb’s blog when I can.
*The new Query Dependencies diagram view available in the Query Editor for Power BI Desktop mentioned recently is also, to my mind, a very important factor for any project that does involve some significant (albeit on a small scale) data transformation. I’m assuming this will be available to Power Query for Excel over the next few months.
Wrapping Up
So to summarize, yes, Excel 2016 and Power BI Desktop share similar technologies for querying (M), modeling (tabular) and analyzing data (DAX). However, there are many differences and unique features to be aware of beyond the most obvious. Per MS Ignite we will soon have the option to import a PBIX model to XLSX and I cautiously assume that SSAS Tabular will also soon support Power Query just as Power Pivot for SharePoint 2016 does.
If you have to choose one tool over the other rather than use them jointly you must also accept that certain use cases and features will not be supported. In this scenario, the choice depends on many factors (licenses, BI infrastructure, team and user composition, etc). Thinking through these questions, getting the most value out of one tool of choice, and planning to build a complete MSBI solution as mentioned at the beginning is something data and analytics consulting firms can help with.

One comment