The following Power BI report uses the Pulse Chart custom visual over Boston BI user group data:
Pulse Chart: Boston BI User Group 2017
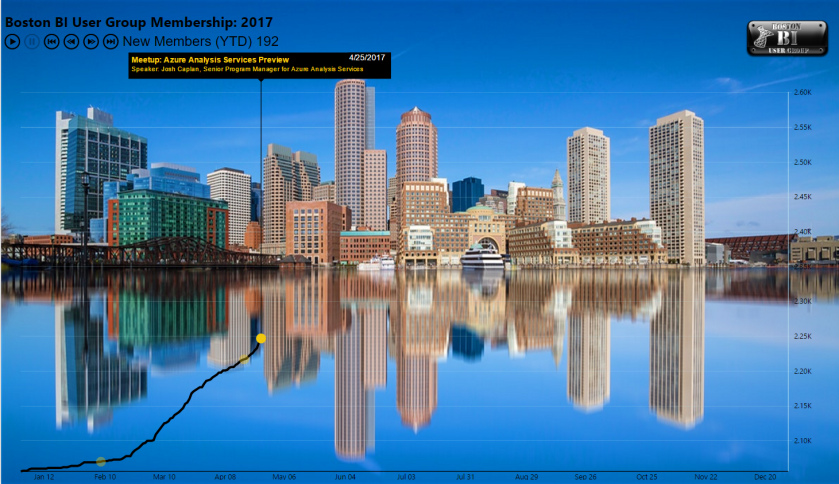
I’ll add a few details to this post describing the creation of this visual next week. Essentially, I just integrated group data from Meetup.com (one-time download of CSV) with a date dimension table from SQL Server and a custom events table.
- Two DAX measures used by the visual include a cumulative member count and a year-to-date new member count.
- The events get called out during playback.
- Unfortunately the gridlines cannot be disabled and there’s limited formatting support for the axis.
- Per the chart, we currently have over 2,600 group members.
